Visibility & Analytics
Operational analytics that show exactly where you are losing money, where capacity is wasted, and which teams are underperforming. Live team tracking that turns dispatchers into decision-makers. Cost-per-stop calculations, SLA monitoring, utilization dashboards, and full BI export - all from one platform built for operations running 50 to 5,000 people in the field.
Telematics tells you where vehicles are. Your CAFM or TMS tells you what jobs exist. Spreadsheets tell you what happened last week. None of them tell you what is costing you money right now, which teams have spare capacity, or where your next SLA breach is coming from.
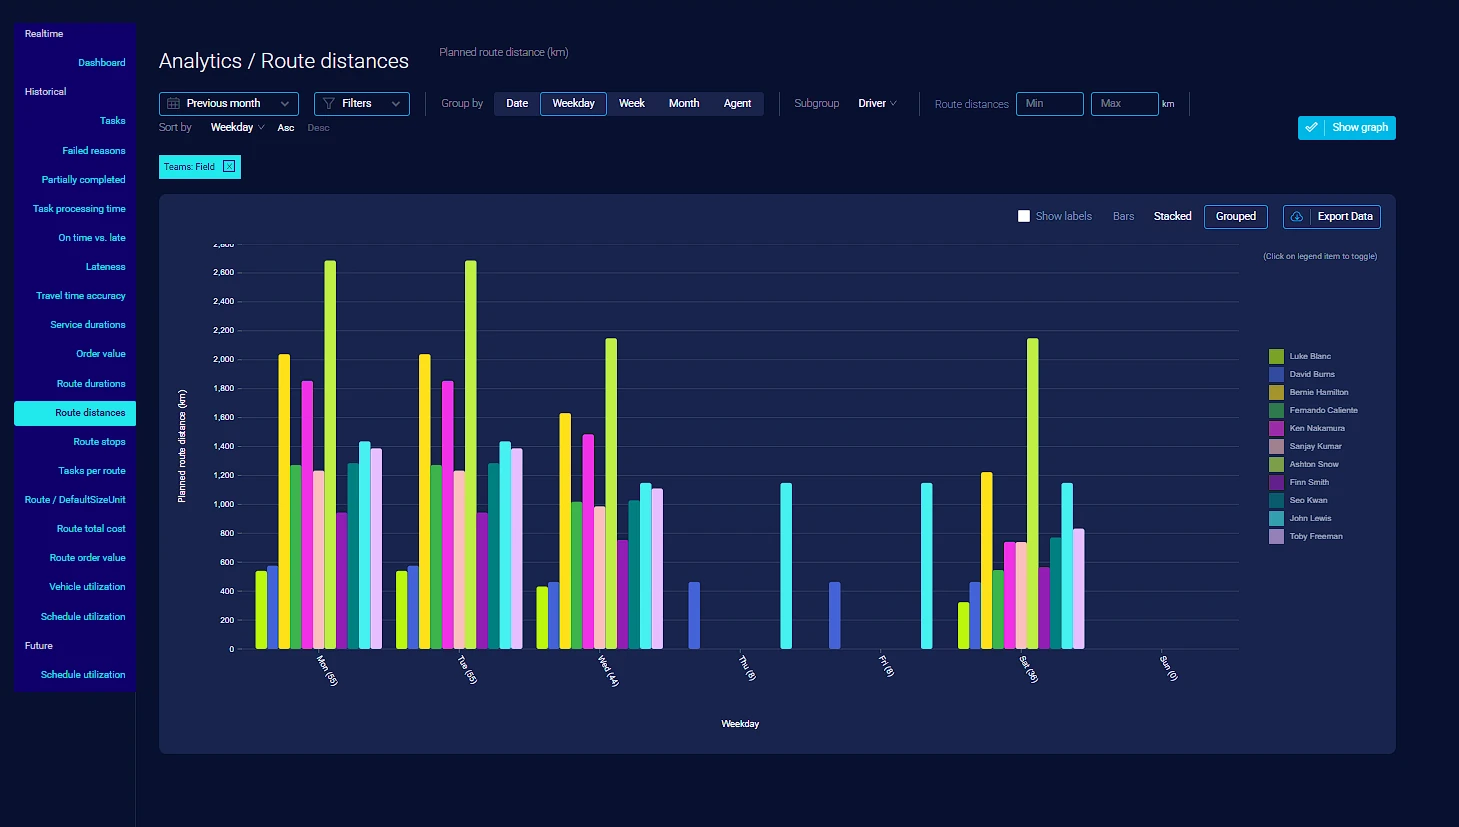
Utilization rates by team, cost-per-stop with tiered bands, historical performance trends, and capacity analysis across your entire team. The data operations directors need to make the case for change - and the dashboards to track it week over week.
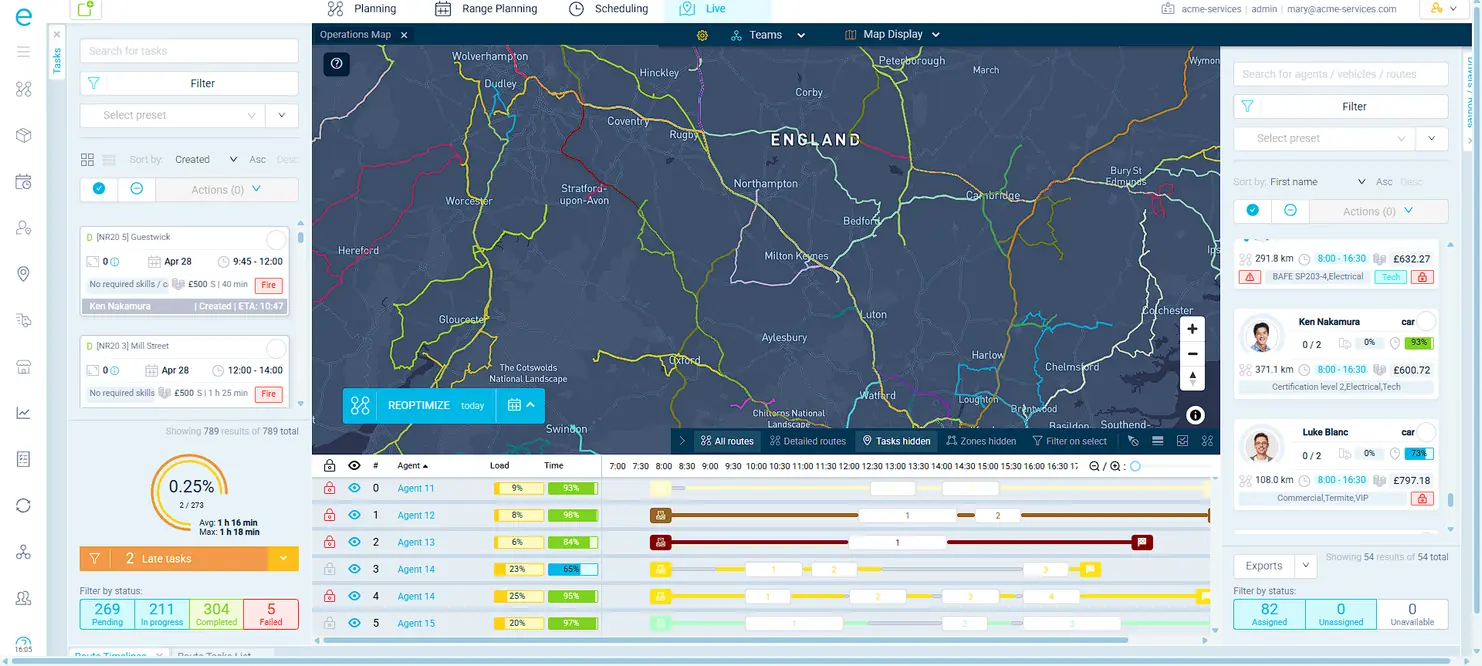
Your entire field operation on a single live map with GPS telemetry, real-time status indicators, and continuously recalculating ETAs. Dispatchers get instant situational awareness across every depot and region - not a 30-minute-old snapshot from your telematics provider.
Drag-and-drop task reassignment, batch operations across hundreds of jobs, route sorting by any metric, saved filter presets, and a Gantt-style timeline view. Your dispatchers manage the exceptions - the optimizer handles everything else.
SLA breach alerts before violations happen. Geofencing that confirms arrival automatically. Dashboard notifications for every exception that matters. The shift from reactive to proactive management changes how your entire operation runs.
These are outcomes from field service and distribution businesses that replaced fragmented telematics, spreadsheet reporting, and guesswork with a single analytics and visibility platform.
Monitor speed, movement status, and location in real time.
ETAs recalculate continuously as conditions change.
Trend analysis across routes, drivers, customers, and time periods.
Real-time cost-per-stop, per-route, and total operational cost metrics.
Track vehicle and driver utilization rates against available capacity.
Automatic detection and flagging of late-running routes and tasks.
Save and reuse custom filter combinations for common views.
Automatic arrival detection and enforcement when entering job locations.
SLA monitoring with proactive breach alerts before violations occur.
Group drivers, vehicles, and resources into managed teams.
Define operational zones with polygon boundaries and automation rules.
Auto-generate optimized routes for repeating schedules.
Manage driver schedules, shifts, breaks, and availability.
Control how much flexibility field teams have over task sequencing.
Manage vehicle profiles, capacities, cost rates, and assignments.
Real-time alerts for exceptions and breaches across SMS, email, and dashboard.
Export and print route manifests, loading lists, and delivery schedules.
Automatically distribute work evenly across your team.
Optimize routes to minimize total operational cost.
Optimize across multiple depots and start locations simultaneously.


"eLogii has fundamentally transformed the way we operate. The productivity gains, enhanced visibility, and ability to scale confidently have been game-changing. The rollout was smooth, the support exceptional, and the results speak for themselves."
Paul Clark, Co-Chief Operating Officer, Richburns
See it with your own data
Utilization dashboards, cost-per-stop analytics, live team tracking, and SLA monitoring - configured with your routes, your teams, and your constraints. See the gap between what you have now and what is possible.