Get A Demo

You're viewing eLogii for Field Service. Distribution business? Switch to Distribution →

Visibility & Analytics

Every vehicle. Every technician. Live on one screen. Total field visibility.

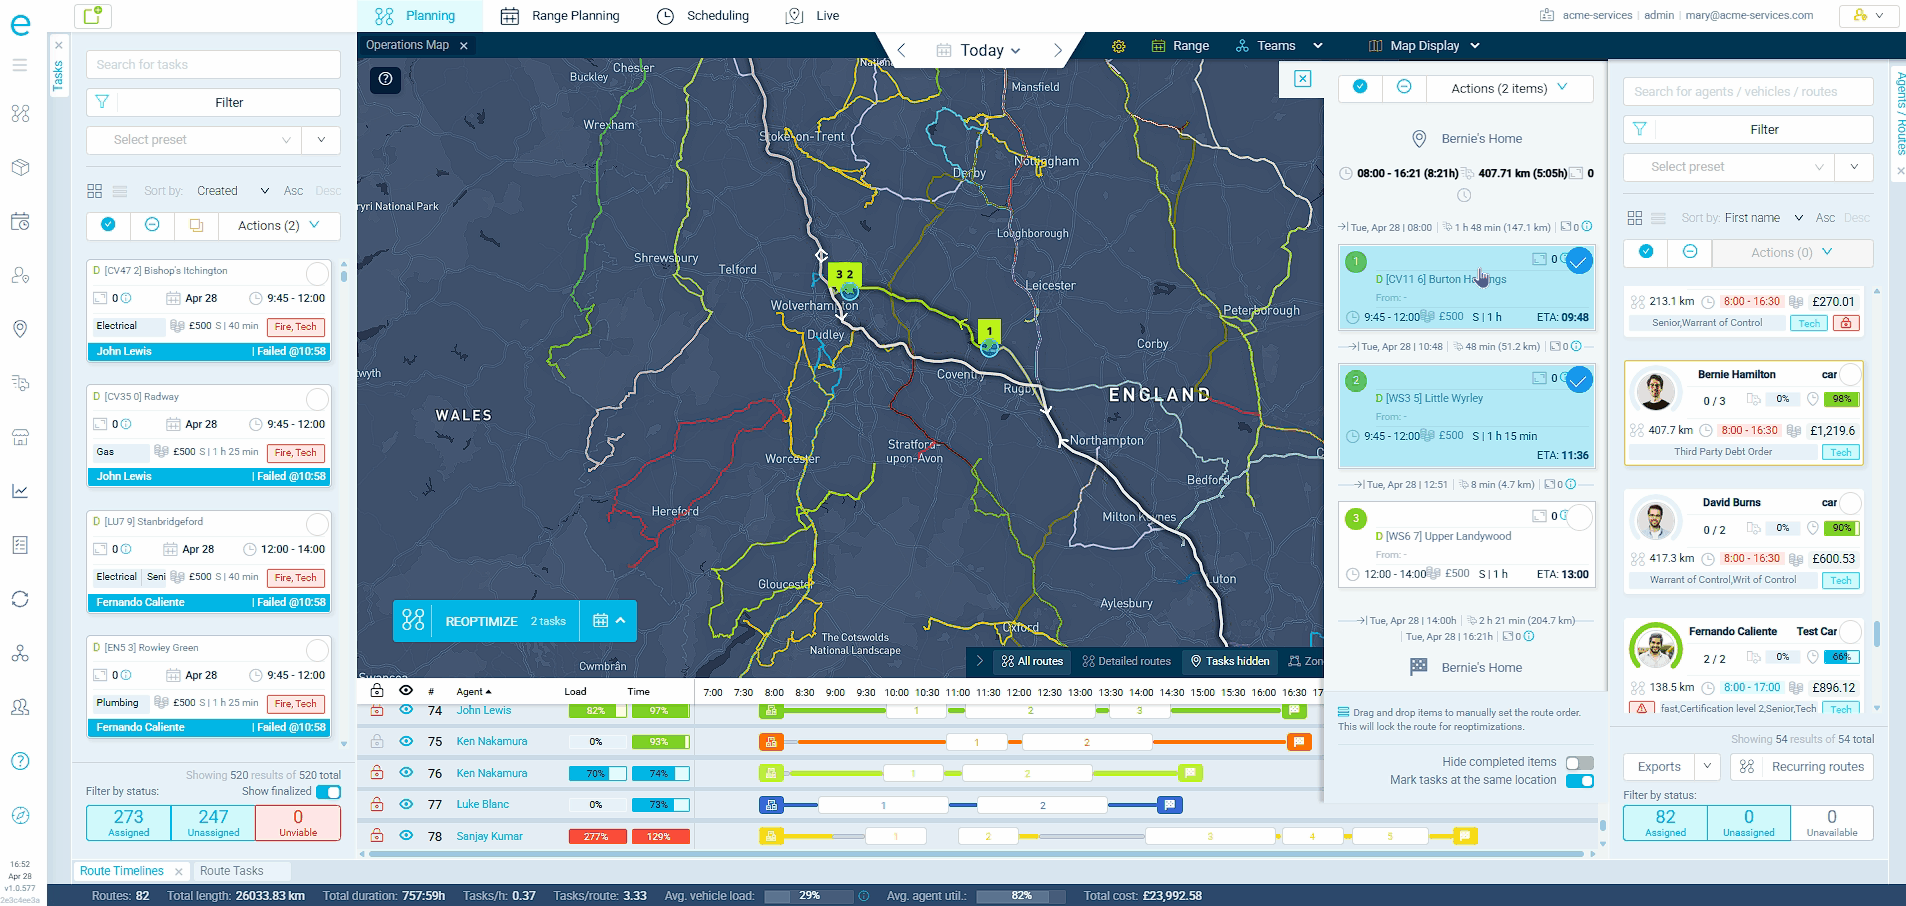
GPS positions update every few seconds on an interactive map with four themes, zone overlays, and route paths. A Gantt-style timeline panel shows every route's progress against the plan. Dispatchers see, act, and reassign - all without picking up the phone or switching screens.

Your telematics shows dots on a map. It does not show you what to do about them.

When you have 50+ vehicles and technicians in the field, knowing where they are is not enough. You need to know who is running late, which routes are off-plan, and what to do about it - all from the same screen.

45min
Average delay before a dispatcher knows
Without live tracking and proactive alerts, dispatchers find out about late-running jobs when customers call to complain - not when they can still intervene and fix it.
40%
Of dispatcher time on "where are you?" calls
Without live tracking, dispatchers coordinating 50+ people in the field spend nearly half their day calling for status updates instead of managing exceptions.
2 screens
Minimum to see and act
Most telematics tools show location. Your routing tool shows the plan. You need both open to make a decision. eLogii puts visibility and dispatch controls on one screen.

An interactive map built for operations, not just location tracking

Four map themes (dark, light, streets, satellite). Tasks appear as clusterable, color-coded markers. Routes display as visual paths. Drivers, zones, depots, and traffic lines toggle on and off independently. Hover any stop for instant details. Select tasks by rectangle, freehand draw, or polygon.

Live GPS with driver telemetry
Vehicle and technician positions update every few seconds. Click any driver to see their full planned route, upcoming stops, current task, and real-time ETA - all on the same screen.
Color-coded task status pins
Pending, in progress, completed, failed, late - each status has its own color. At 100+ tasks per day, this visual system means dispatchers spot problems without reading a single line of text.
Advanced selection modes
Ctrl+drag for rectangle select. Alt+drag for freehand. Multi-click for polygon. Select tasks directly on the map and assign them to drivers with optimization in one action.
Zone, depot, and traffic overlays
Layer service zones, depot locations, and live traffic onto the map. Toggle each independently. Complete operational context without switching to another tool.

See a problem. Fix it. No screen switching.

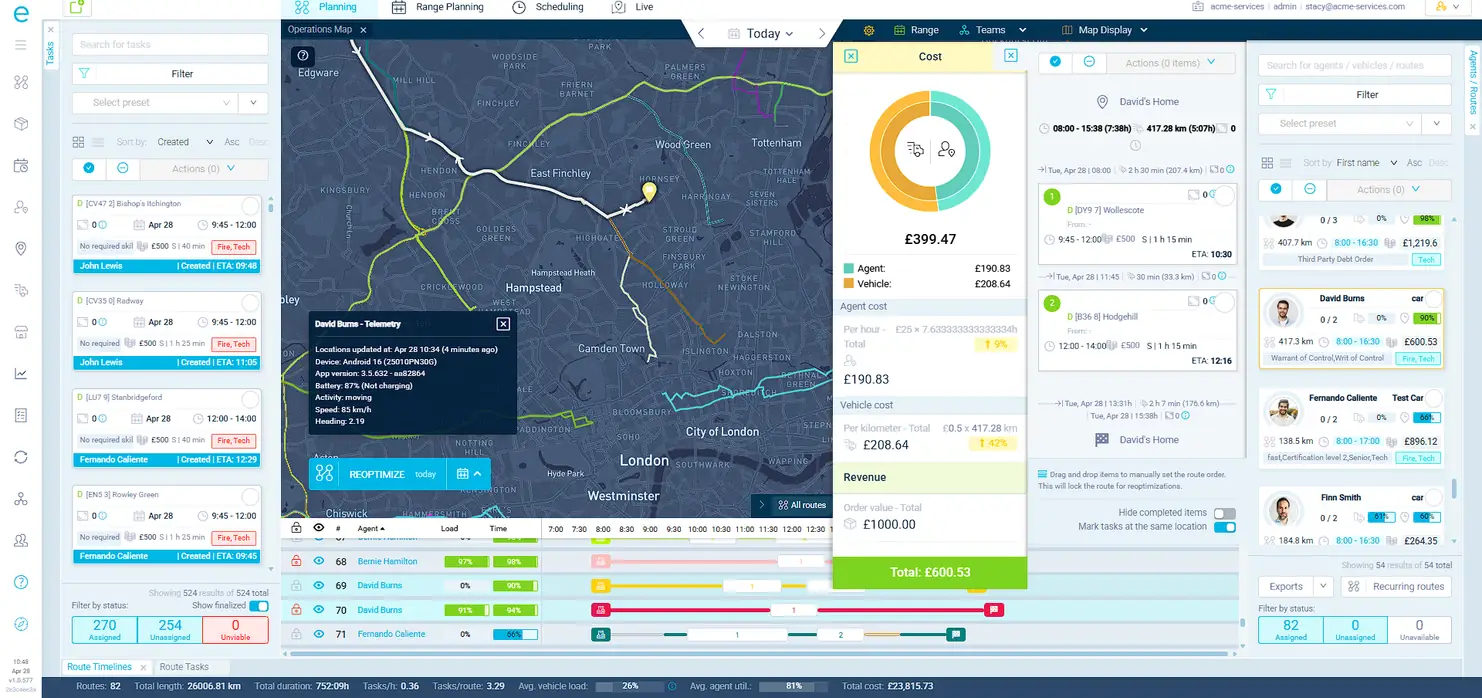
Most tracking tools show you where drivers are. eLogii connects that visibility directly to dispatch controls - drag-and-drop reassignment, live ETA recalculation, route timeline comparisons, and task locking. The map is not just a view. It is the dispatch console.

Drag-and-drop task reassignment
See a driver nearby with capacity? Drag a task from one route to another directly on the map. The optimizer recalculates ETAs for both routes instantly.
Live ETAs that recalculate with traffic
ETAs update automatically when a driver is stuck in traffic, when tasks are added or removed, or when a route is re-optimized. Calculated for every non-finished task on every active route.
Route timeline panel
Switch from map view to a Gantt-style timeline showing every route's progress against the plan. See average vehicle and schedule utilization, stop counts, and cumulative route length at a glance.
Late task filtering with actual vs planned
Dedicated filter shows tasks completed after their time window. See the predicted ETA alongside the actual completion time and exact lateness in minutes. Spot repeat offenders.

What operations teams gain with real-time visibility

Real outcomes from field service and distribution operations that moved from telematics-only tracking to eLogii's operational visibility.

Catch problems before customers call

Live tracking, lateness flagging, and ETA recalculation mean dispatchers intervene before a late arrival becomes a complaint. The shift from reactive to proactive management changes the entire customer experience.

Typical result: 80% fewer reactive escalations

Eliminate "where are you?" calls

When dispatchers can see every driver's position, status, and ETA on one screen, the phone calls stop. For a 50-person field team, that frees up hours of dispatcher time every day.

Typical result: 40% fewer dispatcher-to-driver calls

Reassign work in seconds, not minutes

Drag-and-drop reassignment means a dispatcher who spots a problem can fix it immediately. No phone call, no spreadsheet, no second screen. See the issue, drag the task, and the optimizer handles the rest.

Typical result: real-time exception handling

Planned vs actual route comparison

GPS trail data reveals actual routes vs planned routes. Compare planned start/end times against actual execution timestamps to identify where reality consistently diverges from the plan.

Typical result: continuous route improvement from GPS data
Live
GPS positions updating every few seconds
100k+
Tasks per day without performance degradation
40%
Fewer dispatcher-to-driver calls

Field Visibility

See your entire team. Act from the same screen.

Book a demo and we'll show you the live map, route timelines, and dispatch controls running against a team your size.