Get A Demo

You're viewing eLogii for Field Service. Distribution business? Switch to Distribution →

Visibility & Analytics

13 Analytics for field operations. Live dashboards. Historical trends.

Tasks, routes, costs, lateness, service durations, vehicle utilization, schedule utilization - all tracked automatically. Live graphs update throughout the day. Historical data processes overnight and is ready to filter, group, and export every morning. No spreadsheets. No manual assembly.

Your telematics shows location. Your CAFM shows jobs. Neither shows you performance.

When you have 50+ people in the field, you need answers fast. Which drivers are running late? Which routes are over capacity? What is actually costing you money? Those answers should not require a spreadsheet.

3hrs
Weekly spent building reports by hand
Operations managers export data to spreadsheets and assemble reports manually. That time should be spent acting on insights - not copy-pasting between tabs.
15%
Hidden capacity sitting unused
Most operations have technicians, engineers, and drivers running below capacity but no visibility into utilization rates. That is money left on the table every single day.
45min
Before a dispatcher knows about a problem
Without live tracking and proactive alerts, dispatchers find out about late-running jobs when customers call to complain - not when they can still intervene and fix it.

Live graphs that update as your team moves

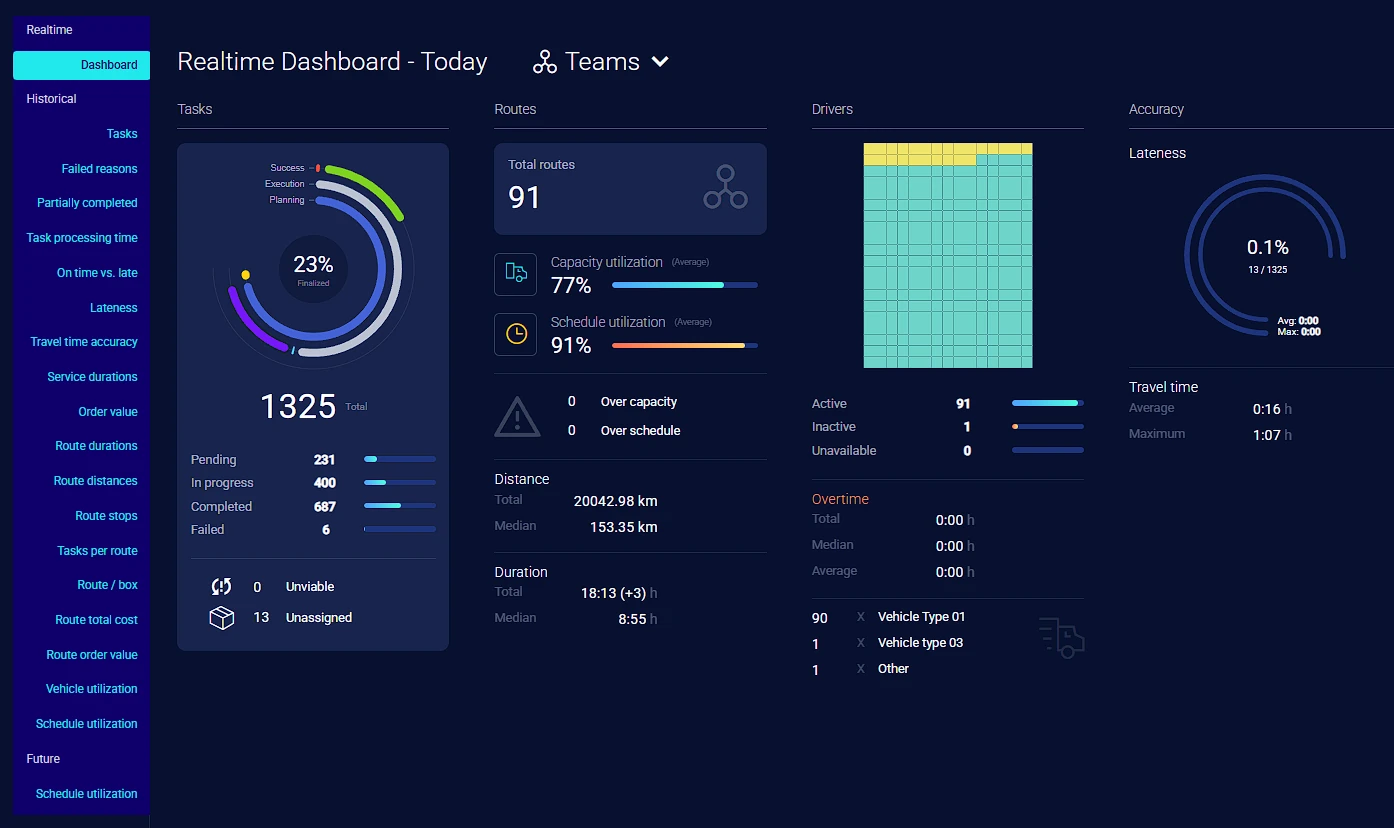
The moment drivers go en route, live dashboards start tracking. Task completion rates, on-time percentages, active vs inactive drivers, vehicle utilization, and overtime - all updating continuously. For a 60-vehicle operation, that means 60 data streams feeding one screen.

Task completion tracking
Total tasks, percentage finalized, status breakdown (pending, in progress, completed, failed), unassigned count, and success rates - all live, all day.
Route and capacity metrics
Average capacity utilization, schedule utilization percentages, total and median route distance, total and median route duration. Flags routes running over capacity instantly.
Driver and accuracy dashboards
Active, inactive, and unavailable driver counts. Driver overtime (total, median, average). Percentage of late tasks with maximum and average lateness values.
Actionable alerts
Over-capacity routes, unviable tasks, and unassigned jobs surface immediately with clickable links that take you straight to the planning screen to fix them.

13 historical segments - processed overnight, ready every morning

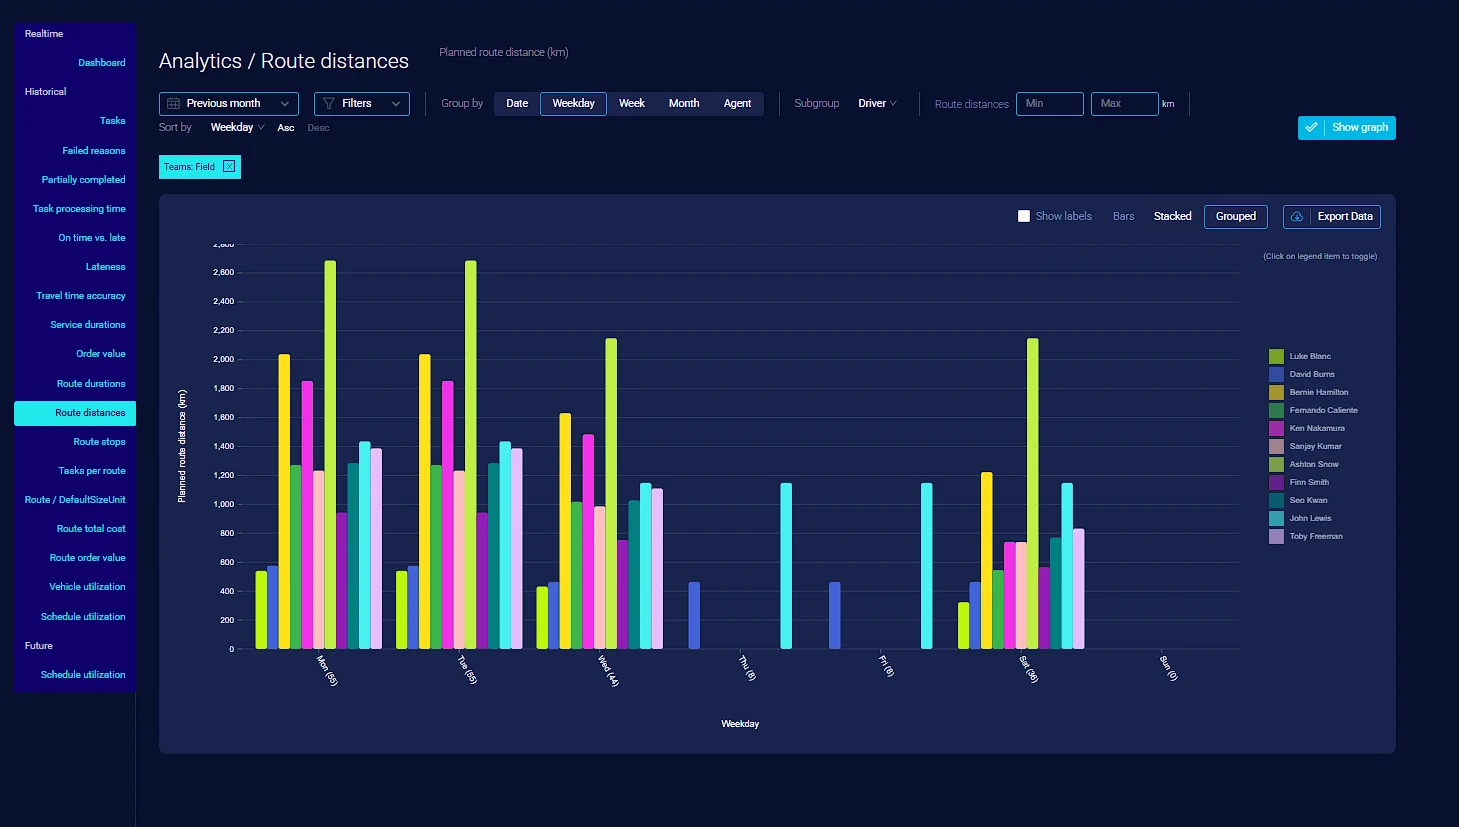
Data processes at the end of each day based on your organization's timezone. By morning, you have complete analytics across 13 segments - filterable by team, driver, customer, or custom date range. Group by date, weekday, week, month, or individual driver.

On-time vs late, lateness minutes, and service durations
See exactly how many tasks hit their window, how late the late ones were, and how long each service visit actually took. Set min/max thresholds to filter outliers and focus on what matters.
Route costs, durations, and distances
Total route cost with min/max thresholds. Route durations and distances in km or miles. Compare planned route distances against actual to spot inefficiency over time.
Vehicle and schedule utilization
Maximum vehicle utilization percentage during each route. Schedule utilization showing how much of each driver's available time was actually used. The data that reveals hidden capacity.
Failed reasons and task processing time
Track why tasks fail with toggle filtering by reason. See how many days pass between task creation and scheduling - revealing bottlenecks in your planning pipeline.

What operations teams gain with built-in analytics

Real outcomes from field service and distribution operations that stopped building reports by hand.

Catch problems before customers call

Live lateness tracking and over-capacity flags mean dispatchers intervene while there is still time to fix the situation. The shift from reactive to proactive management changes the entire customer experience.

Typical result: 80% fewer reactive escalations

Unlock 15-20% hidden capacity

Utilization dashboards reveal technicians, engineers, and drivers running below capacity. Schedule utilization data shows exactly where the slack is - and load-balancing optimization modes fix it automatically.

Typical result: 15-20% more jobs from existing team

Eliminate manual reporting

13 analytics segments with built-in filtering, grouping, and export replace the weekly spreadsheet assembly. Operations managers spend time acting on data, not assembling it.

Typical result: 3+ hours per week recovered

Hit 97%+ SLA compliance consistently

On-time vs late analytics combined with lateness tracking by driver and team mean you spot SLA risk patterns early. Fix them before they become contract issues.

Typical result: 95-97% SLA compliance rate
13
Built-in analytics segments
Live
Real-time task, route, and driver dashboards
3hrs+
Saved weekly on manual reporting

Analytics

See your team's performance in real time. Prove it with historical data.

Book a demo and we'll show you the live dashboards and 13 analytics segments running against your own operation data.