You've probably seen a route optimization pitch built on fuel savings, complete with a payback model that looks clean in the deck and falls apart the moment you apply real scrutiny.
That's the wrong foundation.
Route optimization ROI is an operating leverage decision.
This article gives you the finance-first logic to evaluate it as one, without leaning on a single quoted percentage.
What follows is an evaluation guide for finance leaders weighing a recurring six-figure commitment.
It reframes the return around four things a board actually cares about: EBITDA impact, capacity creation, margin stability, and execution risk reduction.
If you're being asked to defend this spend to an investment committee or a board, this is a great reason to move forward.
Here's a quick overview of what you'll find in this article:
Key Takeaways
- Fuel is supporting evidence, because it's a small, often passed-through, and externally volatile share of cost. A route optimization ROI argument built on it won't survive board scrutiny.
- Labor costs is where the money is in field operations. Labor dominates the cost base, and travel time is paid labor that produces nothing billable. Optimization pays back when it converts that travel time into productive capacity.
- Increasing operational capacity beats cost-cutting. The strongest return shows up as created capacity that lets revenue scale without proportional headcount, which is operating leverage rather than one-time cost trimming.
- Volatility is a financial risk, and things like SLA penalties, repeat visits, planner headcount creep, and unpredictable margins flow straight into the P&L. Reducing execution volatility is downside protection.
- ROI evaporates when optimization stops at planning. That's why gains designed in the plan get lost through static tools and manual overrides unless they're institutionalized in daily execution.
Why CFOs Are Skeptical of Route Optimization ROI
CFOs don't fund optimization for savings, they fund it for control and capacity, and that distinction explains most of the skepticism around route optimization ROI.
You've likely reviewed savings claims that were inflated at the demo stage, anchored to fuel, and impossible to reconcile against actuals a year later.
That history is a reasonable filter, not cynicism.
Fuel-based ROI models are the usual offender. They're easy to build and easy to dismiss, because fuel is volatile, externally driven, and often recovered from the customer anyway.
A model that depends on it collapses the first time a board member asks what happens when fuel prices move the other way.
Software ROI has to survive a different kind of review. It needs to hold up as a change in the shape of your P&L, defensible in the same language you'd use for any capital allocation decision.
This piece is a finance-first evaluation guide, not a savings calculator, and the logic here is designed to stand on its own without a single quoted percentage.
By the end, you'll have a way to build a high-confidence ROI case anchored in the four things that actually matter to finance: EBITDA impact, capacity, margin stability, and execution risk.
Who This ROI Logic Is Built For (and Who It Isn't)
This evaluation framework fits a specific operator profile, and if you don't match it, the operating leverage described here won't materialize.
Placing that filter up front saves you time. Low-fit readers should self-select out now rather than build a case that won't hold.
The table below answers a simple question:
Is route optimization ROI worth evaluating for your organization?
| Criteria |
Strong Fit |
Not a Fit |
| Revenue |
$20m - $300m |
Sub-£10m / very small |
| Fleet or technician count |
50 - 500+ vehicles or technicians |
Low-volume |
| Cost structure |
Labor as the dominant cost |
Asset or fuel-dominant |
| Route type |
Dynamic, high-variability |
Static or fixed |
| Risk exposure |
SLA, compliance, or penalty exposure |
None |
| Existing systems |
FSM / CAFM / telematics already in place |
No systems of record |
If your case for optimization rests entirely on fuel, your routes are static and repeat daily without variation, or you're running a sub-£10m operation, the leverage in this article won't apply to you.
That's not a comment on the software. It's a comment on where labor-driven capacity gains actually come from.
The economics described here depend on a large, variable labor base and real downside exposure to get their return.
How CFOs Actually Evaluate ROI
CFOs evaluate route optimization ROI as a change in the shape of the P&L.
A one-time reduction in a single expense line is easy to model and easy to erode.
A structural change in how output scales against fixed cost is what earns approval for a recurring commitment.
Four lenses do most of the work in a serious finance review:
- EBITDA impact: Does the change improve operating earnings in a way that's durable, or does it just move a cost around?
- Operating leverage: Does output scale faster than fixed cost, so growth doesn't require proportional spend?
- Margin stability: Do margins become more predictable quarter to quarter, or do they stay exposed to field variability?
- Downside protection: Does the investment reduce the risk of penalties, rework, and unplanned cost?
The distinction between cost reduction and operating leverage is the heart of it. Cost reduction shrinks a line item once and then stops paying.
Operating leverage changes how the business scales, which is why it clears a board or investment committee where a savings claim wouldn't.
The rest of this article walks through where that leverage actually comes from.
Why Fuel Savings Are the Weakest ROI Argument
Fuel is the weakest foundation for a route optimization ROI case because it's a small share of total cost, frequently passed through to customers, and volatile due to forces the operator can't control.
Any one of those three would weaken the argument. Together, they disqualify it as a business case.
Consider each point in plain finance terms:
- Small proportion of the cost base: Relative to labor, fuel is a minor line in most field and delivery operations. Optimizing a small cost delivers a small return.
- Frequently recovered: Fuel surcharges and contract pass-through mean savings often belong to the customer, not the operator's margin.
- Externally volatile: Fuel is exposed to commodity price swings you can't influence, so any modeled saving can be wiped out by the market.
None of this means fuel is irrelevant. It's useful as supporting evidence in the wider ROI story.
It just can't carry the business case, and any model that asks it to won't survive a board review.
The Labor Economics of Field Operations
In field operations, labor is the dominant cost, so ROI logic has to start with how labor time is spent, not how many miles are driven.
This is the reframe that changes the whole conversation. Once labor is the center of the analysis, the return stops being about fuel and starts being about how you use paid hours.
Travel time is wasted labor. It's hours you pay for that produce nothing billable and nothing productive.
A technician driving between jobs is a fully loaded cost generating zero output, and every avoidable hour of it is margin you're giving away.
Overtime compounds the problem. When routes are inefficient and days run long, you don't just pay for the extra hours, you pay a premium rate for them.
That premium erodes margin faster than the base cost, because it's the most expensive labor you buy and it's often the least productive.
Route optimization pays back when it converts travel time into productive, revenue-generating capacity. That single sentence is the intellectual center of the ROI case.
You're not trying to spend less on labor. You're trying to get more billable output from the labor you already pay for.
Labor is more than half of the cost base in most of these operations, so a structural improvement in how those hours are used moves the number that matters.
Capacity Creation vs Cost Reduction
The strongest ROI from route optimization shows up as created capacity, not cut cost, because capacity is what lets revenue scale without proportional headcount growth. Cutting cost improves today's number once. Creating capacity improves the trajectory.
The outcomes that matter to finance are specific:
- More output per day: The same team completes more jobs or stops, so revenue rises without a matching rise in labor cost.
- Delayed or avoided hiring: When existing teams absorb more work, the next hire moves out or off the plan entirely.
- Growth without added fixed cost: Volume increases get absorbed by reclaimed capacity rather than new headcount.
This is operating leverage in its clearest form.
Output scales against a fixed labor base, so incremental revenue arrives at a higher margin. It stands apart from efficiency theater, which is activity that looks productive on a dashboard but never changes the shape of the P&L.
The test is simple:
Did the work actually free capacity you can sell, or did it just rearrange the day?
The raw material for all of this is the travel time reclaimed in the previous section. Converted travel time is what created capacity is made of.
Execution Volatility as Financial Risk
Uncontrolled execution is a financial risk, not an operational inconvenience, because variability in the field flows straight into the P&L.
A plan that looks efficient on paper but breaks down daily is a source of unbudgeted cost, and finance should treat it as one.
The financial exposures are concrete:
- SLA and penalty clauses: Missed windows and service failures trigger contractual penalties that hit revenue and margin directly.
- Repeat and failed visits: A job that has to be redone consumes capacity twice, once for the failed attempt and once for the fix.
- Planner headcount creep: As complexity grows, operations often add planners to hold the system together, quietly inflating fixed cost.
- Unpredictable margins: When execution swings quarter to quarter, so does margin, even when the average looks acceptable.
Predictability has real value to a board and to a PE owner.
A stable, forecastable margin is worth more than a volatile one at the same average, because volatility itself is a cost and a risk.
Reducing execution volatility is downside protection, one of the four evaluation lenses, and it belongs in the ROI case alongside the capacity gains.
Why Many Optimization Projects Fail to Deliver ROI
Most route optimization projects underdeliver because the ROI is designed at the planning stage and then lost in execution. The model assumes the plan runs as drawn. Reality rarely cooperates, and the gap between the plan and the day is where the return disappears.
Three failure modes account for most of it:
- Static planning tools: They produce a plan for the morning but can't adapt when the day changes, so the plan is obsolete by mid-morning.
- Manual intervention: Dispatchers and planners override the optimization out of habit or necessity, and each override quietly gives back part of the modeled gain.
- Gains that aren't institutionalized: A good result in one week doesn't become a repeatable daily standard, so the benefit is a one-off rather than a recurring return.
ROI evaporates when optimization stops at planning. The fix isn't a better plan, it's making the gains repeatable and durable through the layer where the work actually happens. That's what the next two sections address.
What Matters Most to a CFO Building a High-Confidence ROI Case
A high-confidence ROI case rests on gains that are repeatable, volatility that measurably drops, capacity uplift that can be observed, and execution risk that stays low over time.
Those four criteria separate a durable return from a demo-stage promise. Apply them to any vendor and the weak cases fail quickly.
Use this as a clean checklist during a route optimization software evaluation:
- Repeatable gains: The benefit recurs every day without heroic manual effort to sustain it.
- Reduced volatility: Margin becomes more predictable, not just occasionally better.
- Measurable capacity uplift: You can observe the same team doing more, and tie it to specific reclaimed hours.
- Low execution risk: Plans survive contact with the field instead of unraveling by mid-shift.
The table below answers what a CFO should look for when choosing route optimization software.
| Evaluation Criterion |
What the CFO Is Really Testing For |
| Repeatable gains |
Does the benefit recur daily without manual effort? |
| Reduced volatility |
Does margin become more predictable? |
| Measurable capacity uplift |
Can we do more with the same team? |
| Low execution risk |
Do plans survive contact with the field? |
None of this requires a benchmark or a quoted figure. The logic holds on its own, and a case that satisfies all four criteria is one you can defend to a board without a single disputed percentage.
Where the Execution Layer Fits
Three layers sit in any mature field or delivery operation, and they do different jobs:
- Systems of record (FSM, CAFM, ERP) hold and plan the data.
- Visibility layers (telematics) show you what's happening in the field.
- An execution layer turns optimized plans into realized outcomes on the ground.
Confusing these categories is where a lot of ROI logic goes wrong.
eLogii is the execution layer. It's the infrastructure that converts plans into realized ROI, stabilizes outcomes over time, and institutionalizes gains so they don't evaporate after planning.
eLogii sits on top of the systems you already run and fills the gap between what's planned or recorded and what actually happens in the field.
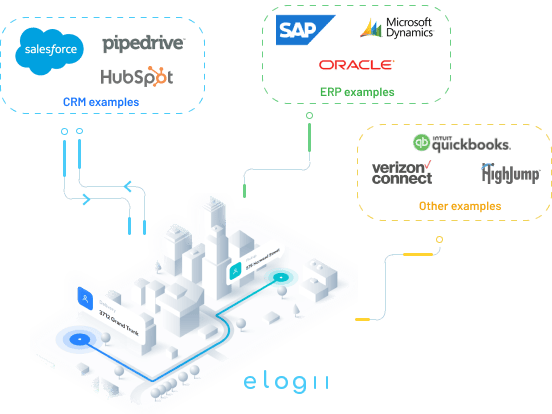
It's complementary to FSM, telematics, ERP, CRM, and WMS, and it never replaces a system of record or a visibility tool.
Here's a few examples of where eLogii sits in the operations management software stack:
Examples of Adding an Execution Layer to Your Current Stack
An execution layer works alongside whatever systems you already have in place, and the point isn't to swap them out.
The table below maps common systems to their category and shows how the execution layer complements each one.
It's always in service of realized route optimization ROI.
| System |
Category |
How the Execution Layer Complements It |
| NetSuite |
ERP / system of record |
Holds financial and order data while the execution layer turns it into reliable, repeatable field outcomes. |
| SAP S/4HANA |
ERP / system of record |
Runs enterprise records while the execution layer converts planned work into realized delivery on the ground. |
| Dynamics 365 Business Central |
ERP / system of record |
Manages core business data while the execution layer institutionalizes daily routing gains. |
| Infor CloudSuite Distribution |
ERP / system of record |
Handles distribution records while the execution layer stabilizes field outcomes and protects margin. |
| Kerridge K8 |
ERP / system of record |
Runs trading and finance data while the execution layer turns plans into repeatable capacity. |
| Manhattan Active WMS |
WMS |
Governs warehouse operations while the execution layer carries optimized plans through to the field. |
| SAP EWM |
WMS |
Manages warehouse execution while the execution layer connects fulfillment to reliable last-mile delivery. |
| Oracle OTM |
TMS |
Plans transportation while the execution layer converts those plans into realized field ROI. |
| project44 |
Visibility layer |
Shows shipment status while the execution layer acts on it to keep outcomes predictable. |
| FourKites |
Visibility layer |
Tracks freight visibility while the execution layer turns that visibility into repeatable delivery outcomes. |
| Geotab |
Telematics / visibility layer |
Reports vehicle and driver data while the execution layer uses it to reduce field volatility. |
| Motive |
Telematics / visibility layer |
Captures fleet telematics while the execution layer converts that signal into stable, realized capacity. |
| Salesforce |
CRM |
Holds customer records while the execution layer delivers on the service commitments those records represent. |
| HubSpot |
CRM |
Manages customer relationships while the execution layer ensures field delivery matches the promise. |
The pattern is consistent across every row.
The system of record holds or plans the data, the visibility layer shows what's happening, and the execution layer turns all of it into reliable, repeatable field outcomes and realized ROI.
Which CFOs Should (and Shouldn't) Evaluate ROI This Way
This ROI logic is built for labor-heavy, high-variability operators with SLA or penalty exposure and existing systems of record in place.
If that describes your organization, the capacity and volatility arguments in this article map directly onto your P&L, and the case is worth building.
If it doesn't, move on.
Fuel-only optimization buyers, low-volume or static-route operations, and sub-£10m businesses won't see the operating leverage described here. And forcing the model onto your profile produces a case that won't survive review.
Run a quick self-test before you proceed:
- Is labor your dominant cost? If yes, the capacity argument applies.
- Are your routes dynamic and high-variability? If yes, there's real inefficiency to reclaim.
- Do you carry SLA or penalty exposure? If yes, volatility reduction has direct financial value.
- Are you under pressure to grow without adding fixed labor? If yes, operating leverage is exactly what you need.
Three or four yeses mean this framework is built for you. Mostly noes mean the return lives elsewhere.
The Bottom Line
If you're a CFO evaluating route optimization software as an operating leverage decision, and the six-figure commitment defends itself on capacity, margin stability, and downside protection long before fuel ever enters the conversation.
That's why:
Fuel is a footnote. Labor and execution are the case.
Your next step is practical:
Take the four-criterion checklist from the high-confidence section into your next vendor conversation and pressure-test whether:
- Gains are repeatable
- Volatility measurably drops
- Capacity uplift is observable
- Plans hold up in the field
If you want to see how the execution layer converts optimized plans into realized ROI alongside the systems you already run, book a demo with us.
We'll show you the exact ROI you can achieve.
FAQ about Route Optimization ROI
What is route optimization ROI for a CFO supposed to evaluate?
Route optimization ROI for a CFO is a durable change in the shape of the P&L, driven by created capacity and reduced execution risk rather than fuel savings. It shows up as more output from the same labor base and more predictable margins. Evaluate it as operating leverage, not as a one-time cost cut.
Why are fuel savings a weak ROI argument?
Fuel savings are a weak foundation because fuel is a small share of total cost relative to labor. It's frequently passed through to customers via surcharges, and it's volatile due to commodity price swings you can't control. Any model built on it can be erased by the market. Fuel savings don't belong in the argument for route optimization ROI, it's only supporting evidence.
How should a CFO evaluate route optimization software?
A CFO should test for four things: gains that repeat daily without manual effort, volatility that measurably drops so margins become predictable, capacity uplift that can be observed against the same team, and execution risk that stays low because plans survive contact with the field. A vendor that satisfies all four supports a high-confidence case.
What size of business should evaluate route optimization this way?
This logic fits operators with roughly $20m to $300m in revenue, 50 to 500 or more vehicles or technicians, labor as the dominant cost, and SLA or penalty exposure, with FSM, CAFM, or telematics already in place. Below that scale, or with static routes and fuel-dominant costs, the operating leverage won't appear. The model depends on a large, variable labor base and real downside risk.
Why do route optimization projects fail to deliver ROI?
Most projects underdeliver because the ROI is designed at the planning stage and then lost in execution. Static tools produce a plan that can't adapt, manual overrides give back the modeled gains, and good results are never institutionalized into repeatable daily operations. ROI evaporates when optimization stops at planning.
What's the difference between a system of record, visibility layer, and execution layer?
A system of record (FSM, CAFM, ERP) holds and plans the data. A visibility layer (telematics) shows what's happening in the field. An execution layer turns optimized plans into reliable, repeatable outcomes on the ground. The three are complementary, and the execution layer sits on top of your systems of record and visibility tools rather than replacing them.