7 Best Apps for Delivery Dispatchers
Top 7 truck dispatch apps for 2024: Find the best solutions for real-time tracking, route optimization, and efficient fleet management.
Home > Blog > Route Tracking: How to Achieve 100% Operational Visibility
Route TrackingLearn how to use route tracking to achieve 100% visibility over your last-mile operations. With explanations, examples and tools for tracking routes.
Route tracking is the key to monitoring deliveries, driver performance, and fleet movements in real-time and over time. So, in this post, we’ll show you EXACTLY how to use route tracking to get total operational visibility.
With the right tracking system, you can reduce delays, improve customer satisfaction, and optimize routes for better efficiency. Whether you're managing a local delivery fleet or a nationwide logistics operation, real-time route tracking gives you insights to help you make smarter decisions.
This is the same process our clients use to track deliveries (pick-ups + drop-offs):
![]()
Route and driver performance:
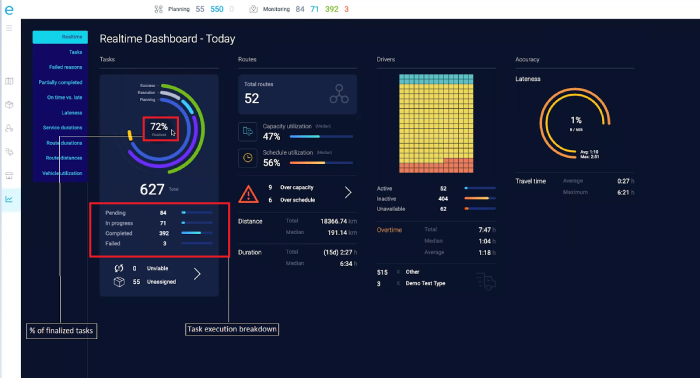
And let customers track their orders:
![]()
So if you want to achieve 100% visibility over your last mile, you’ll love this new guide.
Let’s dive in.
Route tracking is the process of monitoring driver activities on a planned route and analyzing performance as drivers complete their route. Namely, route tracking analysis gathers data, breaks it into segments, and combines matching routes to show them on the map. Common things professionals monitor with route tracking include driver location, route use, task completion, route time and distance, vehicle idle time, and more.
In other words:
Route tracking helps you to know where your drivers are on the route that you have planned for them and how well they are following and completing your instructions.
The main reason to track routes is that it helps your drivers perform better.
That’s because you KNOW what your drivers are doing and how well they are following their planned route… while they’re driving.
With that, here are a handful of other benefits of tracking routes:
Let’s face it:
It’s difficult to know what your drivers are doing once they set off on their route.
So the best way to find out is to see what’s happening in the last mile of your delivery.
And there’s two ways you can go about this:
Your dispatchers can call up drivers to get a report on their location and completed tasks.
(Which can take a lot of time and is frustrating for both drivers and dispatchers.)
Or you can use route tracking software… and see where each one of your drivers are and what they are doing live:
![]()
That way, dispatchers can contact only the drivers that aren’t following their routes. And figure out why.
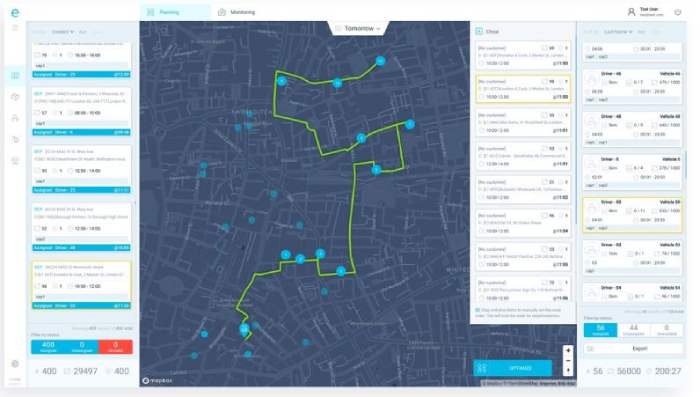
If something isn’t going to plan, you can use the route optimization software to make changes to the route in real time:
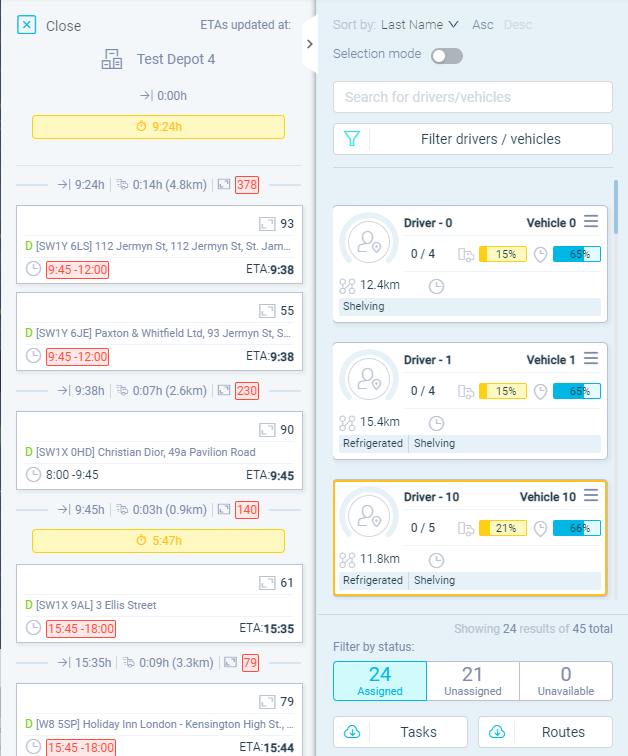
Or, for example, schedule a few of their deliveries with a different driver:
Ideally you’d use all available resources to keep your last-mile delivery running smoothly. Even when problems occur, and the route you initially planned isn’t working out.
And since you’re using software, you’re collecting all of that data:

Which means you can analyze it historically:
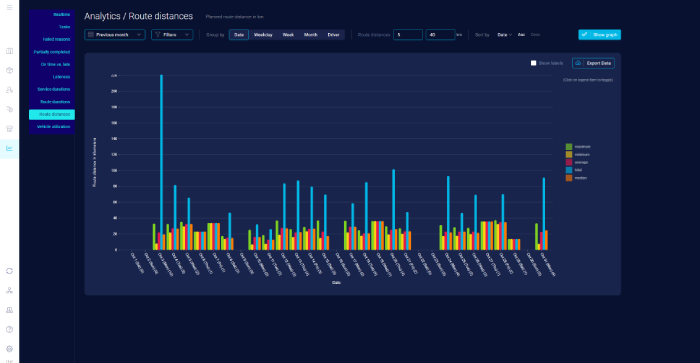
And make changes to your delivery process to improve your operations.
So that you achieve 100% operational efficiency. Continuously.
We’ve already touched upon this:
With route tracking apps, it’s easier to know what your drivers are doing and where they are.
Which makes it easier to manage them while they’re on the road:
![]()
It also means drivers don’t have to report back to the office while they’re driving.
Instead, dispatchers can contact drivers only in case of a problem.
For example, if the driver’s ETA doesn’t match a delivery window, the dispatcher can take action to ensure on-time delivery:
![]()
Route tracking also promotes a practice of drivers calling dispatchers first.
Besides improving internal communication, it also removes the need for manual reporting.
Drivers can focus all of their efforts on providing a better service to customers.
While office staff have more time to anticipate problems and solve them.
For example, if a driver encounters traffic, a driver route planning software helps you to adjust the route based on heavier traffic:

And since you already have route tracking capabilities, it gives you the opportunity to send tracking links to customers:
Which allows you to provide an amazing delivery experience to your customers.
Route tracking saves you time. And…
Time = money.
In fact, route optimization software can save you as much as $1,126.67 per vehicle per month:
![]()
And there’s a lot you can do to lower delivery costs even more.
For example, eLogii enables you to track driver overtime on the route:
![]()
So you can use it to reduce the amount of money you spend covering more expensive hourly rates.
You can also track route distance and duration, which you can use to reduce fuel consumption:
![]()
Or vehicle utilization:
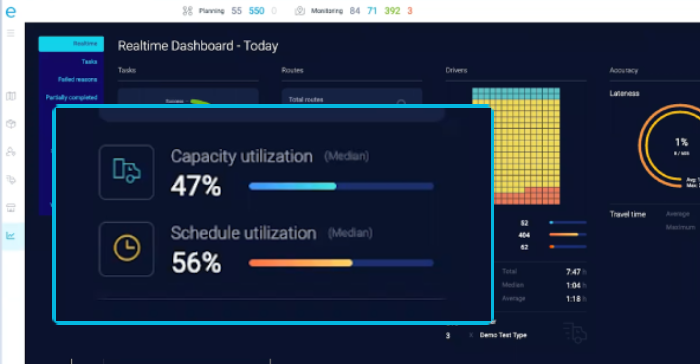
Which enables you to optimize the payload capacity of each vehicle in your fleet.
There’s a lot.
So it may be worth to:
We have developed eLogii as an end-to-end suite for logistics operations. And that means it also acts as a route-tracking app that monitors and controls driver activities along the routes.
So here is some insight into how order tracking works with eLogii.
Customizing the customer’s tracking page with eLogii allows for greater visibility.
![]()
Here are some of the options the tracking page offers:
%20(4).webp?width=635&height=232&name=image%20(1)%20(4).webp)
In the Tracking Page, there are three additional helpful options for customizing orders:
After customizing the dashboard, it is easier to view the live ETA updates.
The eLogii live route tracking feature allows for updates to be sent to the dashboard in real-time.
.webp?width=635&height=328&name=image%20(3).webp)
For instance, in case of a traffic jam, the ETA will automatically update to a later time.
To check the status of a specific driver, select the assigned driver shown on the right side of the screen. The screen will zoom onto their route, showing the current location and the planned stops.
To further check the details of the planned stops, hover over each stop to see the Task name, current location, time window, and ETA.
Some stops have multiple pickups/deliveries, and you will see that information as well:
The left side of the screen shows you all the tasks, and their live states. You can view singular tasks or all of them. Further, you can filter to see tasks of specific categories (such as Late tasks).
To achieve 100% visibility over operations, use the analytics feature on the eLogii dashboard. It’s easily understood and visually digestible, thanks to the charts and numerical values shown.
The two kinds of analytics you can gain insight into are:
Real-time data refers to information of the current day. As the name says, it is updated live as your fleet completes tasks.
Here are some of the crucial metrics to pay attention to to achieve efficient driver tracking:
Since the data is initially displayed in the donut pie chart, you need to hover over the chart to see the precise number of tasks based on their status.
Some other key route metrics on the analytics dashboard are:
When it comes to main driver metrics in the analytics dashboard, they are:
And finally, data accuracy on the dashboard is useful for finding out the number and percentage of late tasks. The travel time part of the dashboard shows you the duration of the routes in average and median data.
For an easily-digestible analysis of past data, use the information shown in the historical data analytics. The information in the historical data part of the dashboard is added after route data gets processed at the end of the day.
You can filter the data by:
You may also group the data by date, weekday, week, month, or driver.
Use the filters to view and compare the data shown in these different tabs:
Bear in mind that you can export the data to your computer for an offline view of your state of affairs.
eLogii has a track record of providing customers with higher performance and better efficiency.
The software saves time for the entire team - from the dispatchers to the drivers and provides customers with better visibility.
As deliveries are a huge part of business strategies, the price you pay for using eLogii is low compared to the ROI it gives you.
And since we believe in total transparency, we are offering you a chance to see how eLogii compares to other automated last-mile delivery solutions.
Speaking of things we offer…
By putting route tracking to use, you are able to achieve full insight into your fleet's activities, driver effectiveness, and delivery productivity. With the help of tools like real-time monitoring, analytics, and automated notifications, you can improve routes, decrease delays, and boost customer satisfaction.
The capacity to monitor historical data allows you to consistently enhance operations, guaranteeing savings and better service.
So, whether you are overseeing local deliveries or extensive logistics, an advanced route tracking system such as eLogii helps you optimize operations and enhance efficiency. As a result, when you choose the appropriate tracking solution, it leads to improved management, reduced expenses, and an elevated delivery experience for your customers.
Top 7 truck dispatch apps for 2024: Find the best solutions for real-time tracking, route optimization, and efficient fleet management.
Explore specialized truck navigation apps for efficient routing, live tracking, and truck-specific features. Ideal for professional trucking needs.
Improve shipment visibility with real-time tracking, smarter routes, and last-mile tools. Save time, cut costs, and keep customers updated easily.
Be the first to know when new articles are released. eLogii has a market-leading blog and resources centre designed specifically to help business across countless distribution and field-services sub sectors worldwide to succeed with actionable content and tips.
