Field service productivity is more than just completing jobs or hitting KPI targets. It’s about how your team spends every hour in the field.
Drive time and work time quietly determine this.
Knowing wrench time helps you to know how much actual revenue-generating work your technicians accomplish each day.
Drive time is the time they spend travelling to job sites for that work. It’s also what undermines your operational efficiency.
In this article, we’ll explain why the ratio between travel and on-site work controls margins, why most teams misdiagnose productivity problems, and how small inefficiencies can compound as your operations grow.
You’ll also see why static scheduling falls short and how execution-layer strategies can protect work time, reduce costs, and scale your field operations efficiently.
Here’s a quick overview of what you can expect in this article:
Key Takeaways
-
Drive time vs work time determines field service margins. Organizations that ignore the ratio between moving and working risk hidden productivity losses.
-
Static scheduling is insufficient. Assigning jobs does not guarantee that time spent on site is maximized or travel minimized.
-
Creeping drive time inflates costs. Without real-time optimization, minor inefficiencies compound across a team of 50+ technicians.
-
False fixes waste resources. Adding staff, tightening schedules, or pressuring technicians does not address the underlying problem. Incremental process improvements are more effective.
-
Execution-layer thinking drives real gains. Dynamic rebalancing, route optimization productivity, and bundling work geographically protect wrench time and improve field service productivity.
What Is Drive Time vs. What Is Work Time and What It Actually Represents for Your Operation
In field service workforce management, two key categories dominate the day: drive time and work time. Understanding what they represent, and why the ratio matters, is critical.
Drive time in field services refers to the time a technician spends traveling between job sites. It's non-productive time, but essential to provide services to customers.
And that's where the problem lies:
Every minute spent in the vehicle is a minute that can't be used to do actual work, whether for installing equipment, performing repairs, or conducting preventive maintenance.
Drive time can also include idle periods, such as waiting for site access. Not all organizations treat this as overtime, but excessive drive time indirectly increases workforce cost.
Work time (or wrench time) is the time field service engineers and technicians spend actually completing work on site. This includes providing services that generate revenue such as installing, repairing, servicing, troubleshooting, and maintaining equipment.
This is the heart of field technician productivity. That's why:
Maximizing wrench time while minimizing drive time is central to field operation optimization. And the balance between these two categories is the drive time vs work time ratio.
Consider this:
A field service technician spends four hours on site and two hours driving between sites. The ratio in this situation is 2:1. That's a healthy balance.
If drive time grows to three hours while work time remains at four, capacity declines, costs rise, and workforce utilization analysis will reveal inefficiencies that static scheduling often misses.
Drive time scales differently than work time.
Adding more jobs doesn't automatically increase wrench time. Instead, it can often increases field technician drive time disproportionately.
Similarly, work-time expansion is constrained by technical skills, job complexity, and customer interaction.
The maximum realistic workforce utilization rate is often only 65% because non-billable tasks—paperwork, prep, or compliance consume up to 35% of working hours, even when teams operate at peak efficiency.
In fact, nearly 75% of field service technicians report spending too much time on paperwork, further limiting potential utilization.
Why does this ratio matter more than raw utilization?
Consider two teams:
Team A shows 50% utilization, but non-billable tasks are only 20% on paper. There is room to improve utilization by 30%, but expecting a sudden jump is unrealistic.
Instead, incremental gains of 10% per month are far more sustainable and prevent technician burnout in the long run. This is where field service productivity optimization actually happens.
Why Drive Time Quietly Expands as Your Operations Scale
Drive time rarely spikes suddenly. Instead, it creeps into field operations, slowly eroding capacity and efficiency over weeks and months.
Unlike glaring operational failures, this increase is subtle. Technicians may not notice it, and managers may falsely assign falling productivity to “slack” or “low utilization.”
Several factors contribute to this silent expansion:
#1 Service Zone Expansion
As field teams grow or take on more customers, the areas that they cover expands beyond the original scope.
Multi-region teams may initially operate within compact, efficiently routed zones. Over time, however, new accounts, urgent contracts, or geographic redistribution of work can push technicians to travel further between jobs.
For example, a technician who originally spent 30 minutes traveling between sites may see that rise to 45–60 minutes daily. This eats directly into available wrench time.
In larger organizations with multiple depots and a mix of preventive maintenance (PPM) and reactive jobs, this effect compounds across dozens of technicians, subtly increasing the cost-to-serve.
#2 Reactive Jobs
Unplanned service calls disrupt schedules. Even teams with highly optimized daily routes can be forced to detour or backtrack to respond to emergencies.
A reactive job in the middle of a previously efficient route can add 15–30% extra drive time for the rest of the day.
More than 80% of mobile workers report struggling to balance speed and quality when delivering service and support to customers.
Reactive jobs are a major factor in this stress. Technicians are supposed to travel further, while trying to maintain service standards with a higher workload.
This is unrealistic even for the best field technicians.
#3 Poor Job Sequencing
Static or manually created schedules rarely optimize for geographic proximity. Without route optimization, technicians may zigzag across their service zones, turning what should be a 10-mile route into 20 or 25 miles.
Even if the utilization rate appears strong on paper, the reality is that field technician drive time increases while work time diminishes, reducing overall capacity.
#4 No-Access to Job Sites
Missed appointments and inaccessible sites require return visits. A technician traveling 30 minutes to a site only to be turned away effectively doubles the travel burden for that job. In multi-region operations handling dozens of jobs per day, these small inefficiencies quickly accumulate.
#5 Fragmented Routes
Assigning jobs without considering geographic clustering or skill matching fragments routes, forcing technicians to spend more time traveling and less time working. Even when workforce utilization appears healthy, the team may be underperforming because drive time silently reduces productive hours.
#6 Incremental Inefficiency Is Invisible
Drive-time inflation is rarely obvious in day-to-day reporting. A 5–10% increase in drive time may not trigger alarms in workforce utilization analysis, but the cumulative effect is significant:
Less wrench time per technician, increases idle time growing overtime costs. In fact, if drive time increases by 10%, capacity for revenue-generating work often falls by a similar proportion, impacting field service cost to serve, SLA performance, and customer satisfaction.
#7 Complexity in Multi-Depot Operations
In larger organizations, dispatching from multiple depots without integrated route optimization can exacerbate drive-time growth.
Overlapping territories, uncoordinated routing, and uneven workload distribution cause technicians to cover more ground than necessary, quietly inflating costs and margin erosion.
Result: Drive Time Inflation
The cumulative effect of these factors is subtle but powerful.
Drive-time inflation quietly consumes capacity, erodes margins, and stresses technicians.
Most teams misdiagnose the problem because traditional metrics (technician utilization, workforce utilization rate, or even job counts per day) don't capture the hidden burden of extra travel.
Static scheduling, top-down utilization targets, and periodic reporting are insufficient to address a challenge that evolves continuously in real time.
Managing this “silent growth” requires more than scheduling;
It demands continuous monitoring, dynamic route adjustment, and geographic bundling of work. Something that most organizations fail to understand.
False Fixes: Why Teams Attack the Wrong Levers
Many organizations misdiagnose productivity issues and apply fixes that address symptoms, not the root cause:
-
Pressuring technicians: Pushing staff to complete more jobs per day increases stress but does not reduce drive time. It often lowers quality and may increase idle time.
-
Hiring more technicians and engineers: Adding headcount without addressing travel inefficiency only spreads the problem. Drive-time inflation continues to erode margins.
-
Tighter and "better" schedules: Shortening time slots per job may improve apparent workforce utilization but reduces wrench time in maintenance and quality. More errors mean repeat visits.
-
Hiring more planners: More planners can improve scheduling, but without dynamic rebalancing, drive time still creeps, leaving capacity underutilized.
-
Investing in visibility tools: Visibility does not equal control. Seeing delays or travel inefficiency does not automatically reduce drive time.
These interventions fail because they ignore the fundamental driver:
How much of a technician’s day is spent moving vs. working. Without adjusting the drive time vs work time field service ratio, teams may experience minor gains at best, while incurring significant costs.
How Higher Drive Time Impacts Your Cost-to-Serve
The economic implications of an imbalanced drive time vs work time ratio are HUGE. Even small increases in drive time can have a domino effect across an entire field operation, affecting cost, capacity, and service quality. This includes:
-
Fewer jobs per day: When technicians spend more time traveling, the number of revenue-generating appointments they can complete declines. For a team of 50 technicians, even a 10% increase in drive time could reduce completed jobs by hundreds per month.
-
Higher overtime: Extended drive time consumes standard working hours, forcing technicians into overtime to meet SLAs. Overtime increases wage costs and contributes to fatigue, which can affect quality.
-
Planner overhead: Organizations often respond to inefficiency by hiring additional planners. While this may improve scheduling visibility, it adds overhead without addressing the root cause: excessive travel.
-
Higher vehicle and fuel costs: Every extra mile traveled adds not only fuel costs but also vehicle wear and maintenance expenses. Across large teams, these costs scale rapidly.
-
SLA risk: Delays caused by longer travel times jeopardize service commitments. Missed SLAs can damage customer satisfaction and incur penalties.
Even modest increases in drive time have compounding effects. For example:
If drive time rises by 15%, field capacity may drop by 12–15%, even if technician utilization appears sufficient on paper. For larger teams, the cumulative cost is substantial.
The table below illustrates the estimated impact of a 15% drive-time increase on capacity, overtime, and fuel costs for teams of varying sizes. (Assumptions: 8-hour workday, average technician completing 5 jobs/day, fuel cost $0.50 per mile, and a 15% increase in travel time.)
|
Team Size
|
Jobs Lost per Day
|
Overtime Hours per Day
|
Extra Fuel Cost per Day
|
Monthly Jobs Lost (20 working days)
|
Monthly Extra Fuel Cost
|
|
5 technicians
|
4–5
|
2–3
|
$12–15
|
80–100
|
$240–300
|
|
10 technicians
|
8–10
|
4–6
|
$24–30
|
160–200
|
$480–600
|
|
50 technicians
|
40–50
|
20–30
|
$120–150
|
800–1,000
|
$2,400–3,000
|
|
100 technicians
|
80–100
|
40–60
|
$240–300
|
1,600–2,000
|
$4,800–6,000
|
|
500 technicians
|
400–500
|
200–300
|
$1,200–1,500
|
8,000–10,000
|
$24,000–30,000
|
These numbers demonstrate how small inefficiencies in field technician drive time scale dramatically with team size.
Multi-depot, multi-region operations are particularly vulnerable:
Even if individual technicians appear productive, cumulative drive-time inflation can lower margins, increase field service cost to serve, and threaten SLA compliance.
For high-volume operations, the lesson is clear: managing the drive time vs work time field service ratio isn't optional. It's essential for profitability, operational efficiency, and customer satisfaction.
But static scheduling alone can't prevent this compounding effect.
Why Scheduling Alone Can’t Fix Drive-Time Inflation
Scheduling assigns jobs; optimization allocates time. While it may seem like a minor distinction, it is the difference between merely filling a technician’s day and maximizing actual field service productivity.
Static scheduling tools provide planners with a blueprint of who works where. They allocate jobs based on availability, skill, or priority.
But this allocation is fixed: once the schedule is set, it rarely adapts to real-world conditions. Traffic congestion, last-minute cancellations, emergency requests, and site-access delays all disrupt static schedules.
A technician might arrive late, skip breaks, or travel extra miles just to keep appointments, which increases field technician drive time and reduces wrench time. Over a week, these small inefficiencies compound, quietly inflating the cost-to-serve.
Consider a multi-depot, multi-region team handling a mix of preventive maintenance and reactive jobs.
A static schedule may assign a technician to five jobs across a wide geographic zone, assuming average travel times. If one site is inaccessible due to a locked gate or delayed customer, the technician must backtrack or take a longer route.
Even if workforce utilization appears acceptable on paper, actual productive work declines. Non-billable tasks such as administration, reporting, and idle time can consume up to 35% of a technician’s day, meaning the maximum realistic utilization rate is around 65%.
What High-Maturity Field Operations Do Differently to Improve Field Service Productivity and Reduce Drive Time
High-performing field teams don't leave productivity to chance.
They adopt practices that explicitly manage the delicate balance between drive time and wrench time, ensuring that technicians spend the majority of their day on revenue-generating work.
These practices go beyond static scheduling, focusing on execution, real-time adjustments, and continuous improvement.
Here are several things high-maturity organizations do that positively impacts field service productivity:
Continuous Re-Optimization
Rather than relying on a static plan, mature operations adjust schedules in real time.
Traffic congestion, last-minute customer requests, or emergency jobs can disrupt even the most carefully planned routes.
Continuous re-optimization ensures that technicians are dynamically rerouted to minimize drive time while maximizing wrench time.
For example, a team handling 50+ technicians across multiple depots might experience small delays at several sites. If left unmanaged, these delays compound, reducing daily capacity by 10–15%.
With real-time optimization, jobs can be reassigned to nearby technicians, backtracking is minimized, and overall field service productivity is maintained.
Bundling Work by Geography and Site
High-maturity teams group jobs logically to reduce unnecessary travel.
Instead of dispatching technicians to distant, fragmented jobs, planners bundle work in clusters, ensuring that technicians complete multiple tasks in one area before moving to the next.
This geographic bundling increases wrench time in maintenance per hour on the clock and reduces idle time between tasks.
It also improves customer satisfaction because service windows are more predictable, and technicians arrive promptly.
Multi-region operations that implement bundling consistently see reductions in field technician drive time of 15–20%, translating directly into higher field service workforce management efficiency and lower field service cost to serve.
Dynamic Reprioritization
Emergencies, SLA requirements, or high-priority jobs are unavoidable in complex field operations.
High-performing teams incorporate dynamic reprioritization, slotted by real-time urgency and technician availability. This ensures urgent tasks are completed quickly without disrupting the efficiency of the entire schedule.
For instance, if a reactive job arises in a busy zone, a dynamic system can reassign nearby tasks to other technicians or adjust routes, minimizing idle time and protecting scheduled wrench time.
Teams that do not use this approach risk service delays, overtime, and hidden inefficiencies that erode field operations efficiency.
Planners Supervising Outcomes
In mature operations, planners do more than assign jobs. They monitor execution.
By tracking actual drive time vs work time metrics, planners identify patterns, coaching needs, and systemic inefficiencies.
This enables continuous improvement: routes are adjusted, jobs are matched to the most appropriate technicians, and underperforming areas are addressed proactively.
For example, if most team members average 75–85% utilization, but one technician averages 50%, planners can investigate whether the issue is skill mismatch, poor route assignment, or training gaps.
Targeted interventions such as service training can reduce underutilization by 30%, turning an underperforming team member into a high-impact contributor.
Measurable Performance and Productivity Gains
Implementing these practices delivers concrete results. Scheduling automation with continuous re-optimization has been shown to increase dispatch efficiency by 60%.
Teams that bundle jobs geographically and reprioritize dynamically reduce drive time, overtime, and idle time, while protecting wrench time.
Multi-region, multi-depot operations handling dozens of technicians can scale capacity without adding headcount, maintaining profitability even under growth pressures.
High-maturity operations demonstrate that field service workforce management isn't about maximizing utilization on paper. It’s about protecting field technician productivity, minimizing field engineer drive time, and ensuring that every hour in the field generates value.
By focusing on real execution, these teams turn operational complexity into a competitive advantage.
How eLogii Helps to Reduce Drive Time, Increase Work Time, and Improve Field Service Productivity
In complex field operations, the gap between planning and execution is where productivity is most often lost.
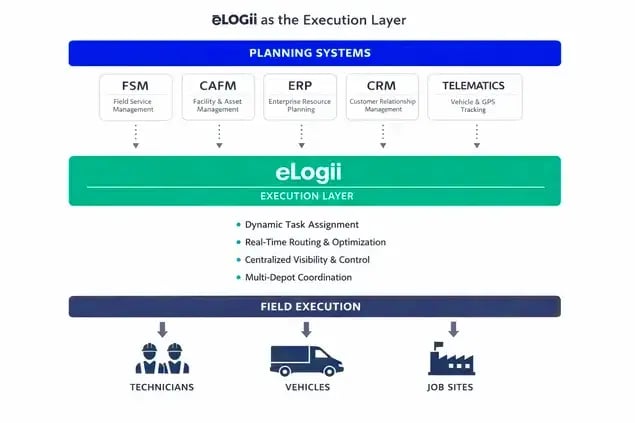
This is where eLogii operates:
eLogii is an execution layer that bridges the strategic plan with real-world outcomes.

While FSM, CRM, ERP, and telematics systems provide scheduling, customer data, and vehicle insights, they rarely ensure technicians spend most of their time performing work that generates revenue.
eLogii is specifically designed to help you protect wrench time in maintenance and minimize field technician drive time. And deliver measurable improvements in your field service productivity.
Here's exactly how adding an execution layer with eLogii helps you to achieve this:
-
Continuous Monitoring and Dynamic Optimization: eLogii continuously tracks both drive time in field service and work time, providing visibility that static schedules can't. This real-time monitoring identifies bottlenecks, route inefficiencies, and instances where reactive jobs or site-access delays disrupt productivity.
-
Field Operation Optimization: One of eLogii’s core strengths is field operation optimization. By combining routing intelligence with operational data, it allows you to make informed decisions, ensuring technicians are matched to the right jobs, in the right location, at the right time.
-
Reducing Drive Time in Field Operations: eLogii reduces it by dynamically re-bundling jobs geographically. Rather than relying on a static schedule, it groups jobs in clusters, reroutes technicians in real time, and reprioritizes tasks to minimize backtracking.
-
Workforce Utilization Analysis: eLogii provides a data-driven view of workforce utilization, comparing planned schedules against actual outcomes. This allows you to see where technicians are underutilized, identify coaching opportunities, and adjust job assignments based on skill and historical performance.
-
Protecting Margins and Reducing Hidden Costs: eLogii helps you to keep technicians on site longer and driving less. By allowing you to dynamically plan preventive and reactive jobs at the same time, the software mitigates margin erosion from hidden travel costs, unplanned overtime, and fragmented routes. Together with advanced route optimization, this protects daily work-time share of technicians and engineers.
-
Execution Over Scheduling: Unlike traditional FSM or CRM tools, which primarily focus on scheduling, eLogii focuses on execution. Scheduling tells technicians where to go; eLogii ensures they spend the majority of their day performing work rather than traveling. It turns static schedules into a continuous optimization process, dynamically adjusting to real-world conditions, protecting wrench time, and enhancing technician productivity.
eLogii functions as the operational backbone for field teams, enabling:
-
Field operation optimization for multi-region, complex deployments.
-
Reduced drive time field operations, increasing daily wrench time.
-
Workforce utilization analysis, identifying coaching and efficiency opportunities.
Field service margin erosion mitigation, lowering hidden costs and improving profitability.
By focusing on the execution layer, eLogii bridges the gap between planning and results,
This ensures that every minute in the field your technicians spend drives tangible value for your organization.
Who This Thinking Is (and isn't) For
Not every organization benefits equally from focusing on drive time vs work time or implementing an execution-layer approach.
Understanding whether your operations are a good fit can save time, resources, and prevent misapplied investments.
Right for:
- Margin-sensitive operations: Companies where field service cost to serve drives profitability. Small inefficiencies in drive time can significantly erode margins.
- Multi-job-per-day field teams: Organizations managing 20–50+ technicians with multiple jobs daily, especially where balancing preventive maintenance and reactive service is critical.
- Growth-oriented operations: Teams planning to scale geographically or in volume, where protecting wrench time and minimizing overtime are strategic levers for sustainable growth.
- Complex multi-depot environments: Operations where routes, territories, and technicians require continuous rebalancing to maintain field operations efficiency.
Not for:
-
Static or single-route teams: Organizations operating with fixed, predictable routes and minimal variability. Drive-time optimization yields little additional value.
-
Low-volume service models: Teams handling fewer than 5–10 jobs per day or operating within compact zones where travel time is negligible.
-
Price-only buyers: Companies focused solely on procurement cost rather than field technician productivity or operational efficiency.
-
Highly manual, low-tech operations: Teams without digital tools or field workforce management systems may not realize immediate ROI from execution-layer investments.
Bottom Line: Go Beyond Drive Time to Improve Field Service Productivity
Field service productivity depends more on managing drive time than simply increasing utilization.
Static scheduling, headcount, or pressure tactics are insufficient. By focusing on the drive time vs work time ratio, organizations protect wrench time, reduce overtime, and scale profitably.
eLogii provides the execution layer that turns this theory into practice, enabling you to apply continuous optimization, geographic bundling, and dynamic reprioritization.
For your organization, this can be a sustainable path to growth and improved margins.
So, what's the next step?
First, analyze your drive-to-work ratio, Then, you can reach out to us.