We’re SUPER excited to introduce you to eLogii’s route analytics feature.
Route analytics is a new, data-driven way to evaluate and optimize your delivery, field service, supply chain, and logistics operations.
eLogii’s route analytics capabilities provide you with greater data collection accuracy than other tools. Which allows you to track performance from request to delivery across an order’s entire journey.
Our route analytics also features all new reports and enhanced ways of using real-time and historical data to find powerful opportunities to continuously optimize your operations.
In this guide, we’re going to cover everything you need to know about route analytics, how to navigate its reports, and how to successfully use data to drive even more efficiency in 2025.
What Is eLogii's Route Analytics?
Route analytics is a software feature of route optimization and planning solutions that allows you to track, collect, and evaluate route data and delivery metrics. It’s a tool you can use to review route efficiency, driver performance, delivery success rates, and find ways of improving logistics operations based on data.
Why Are Route Analytics Important in 2025?
The main reason to use route analytics in 2025 is that it helps you find opportunities to improve performance of your delivery, field service, supply chain and logistics beyond route optimization.
That’s because tools like eLogii don’t just optimize your current, day-to-day operations. They also track and store data live and over time, to give you valuable insights into the performance of your business.
So you can use those insights to check the efficiency of your operations, and implement further changes that can boost performance.
In doing so, you will continuously generate even more efficiency as you keep using the software.
How Does eLogii’s Route Analytics Work?
eLogii works based on tasks:
One task = one stop.
(Order/supply/delivery pick-up or drop-off.)
Route Analytics tracks and displays all tasks, routes, and drivers in real time:
These are processed live as a change to a task, route, or driver is logged via the dashboard and driver app.
eLogii also processes all tasks at the end of each day (24:00).
At this point, each task will have its final state: Completed, Failed, Pickup Failed, Canceled, etc.
This state is logged and displayed in the Analytics Tab:
Similarly, eLogii’s Route Analytics tracks, logs, and displays other parameters related to routes, driver performance, service times, and much more.

The number of tasks scheduled for a specific date will match the number of tasks in Analytics.
In case, the numbers don’t match, the final state of a task has been changed to something else.
Or the task has been moved to the next day. And it will be displayed for that date.
But there isn’t a situation where a task goes missing.
(Unless it was manually deleted from the schedule.)
What Type of Routing Data Can You Collect with eLogii?
eLogii Route Analytics collects and processes a variety of route data.
The data is displayed as Real-Time Analytics and Historical Route Analytics.
This gives you in-depth insight into the current state of your operations.
But also your operational performance over time.
Here is all the type of data eLogii’s Route Analytics collects:
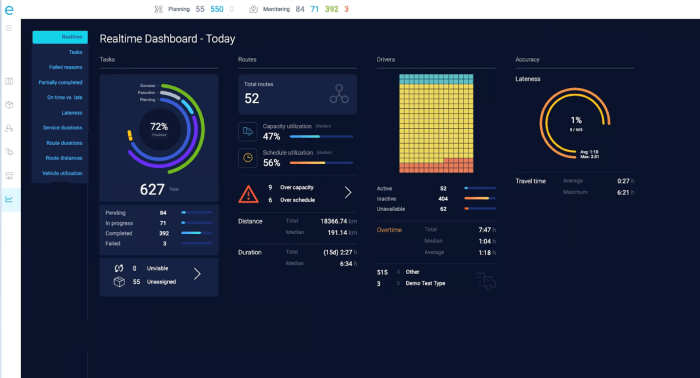
eLogii’s Real-Time Route Analytics
Real-time route analytics displays route data for the current date. This data is updated live (second by second) as drivers move along their routes and perform tasks.
Real-time metrics are divided into four groups:
eLogii displays live data on a single screen:
Task Metrics
Task metrics includes a complete overview of your success rate, task breakdown, and execution for the current date:

-
Finalized Tasks (%): all tasks that have been finalized successfully (until this moment) displayed as a percentage of all tasks planned for the current date.
-
Successful Tasks (%): tasks that have been successfully completed (until this moment) displayed as a percentage of all tasks planned for the current date.
-
Executed Tasks (%): tasks that have been executed (until this moment) displayed as a percentage of all tasks planned for the current date.
-
Planned Tasks (%): tasks that have been planned, scheduled, and assigned to drivers (until this moment) displayed as a percentage of all tasks for the current date.
-
Total Tasks: all tasks that have been uploaded to the dashboard for the current date (including assigned and unassigned tasks).
-
Pending Tasks: all tasks that have been assigned to drivers and have yet to be started (all stops on a route after the driver completes his current delivery).
-
In Progress Tasks: all tasks that are currently in progress (the driver has reached his destination and is dropping off the order to the customer).
-
Completed Tasks: all tasks that have been completed successfully by drivers until this moment (the order is dropped off and received by the customer).
-
Failed Tasks: all tasks that have not been completed successfully by drivers until this moment (customer wasn’t home to receive the order; driver failed to find the address).
-
Unavailable Tasks: all tasks that were uploaded to the dashboard but unavailable for planning and scheduling.
-
Unassigned Tasks: all tasks that were uploaded to the dashboard but were unassigned to drivers when the routes and schedules were being planned.
Clicking the arrow next to Unviable and Unassigned tasks redirects you to the planning screen.
There, you can handle these tasks or anything that you haven’t addressed yet regarding them.
Route Metrics
Route metrics displays data related to your operational planning and how efficiently you use your resources to complete tasks. Live route metrics that you can track with eLogii include:

-
Total Routes: all routes that have been planned and optimized for the current date and assigned to drivers.
-
Capacity Utilization: total space inside of the vehicles (payload capacity) that has been used to carry orders for the current date displayed as a percentage of your total fleet capacity.
-
Schedule Utilization: total time that has been used to complete tasks for the current date displayed as a percentage of total available work hours.
-
Over Capacity Warning: number of items that exceed the predetermined capacity of a vehicle or package size.
-
Over Schedule Warning: number of items that exceed the predetermined duration for a task or driver work hours.
-
Distance (Total): total distance covered by all of the drivers on their current routes (until this moment).
-
Distance (Median): median distance covered by each driver on their current routes (until this moment).
-
Duration (Total): total time used to cover routes and complete tasks on those routes (until this moment).
-
Duration (Median): median time used to cover routes and complete tasks on those routes (until this moment).
Driver Metrics
Driver metrics display the data related to your entire fleet. These metrics include the availability of drivers and vehicles and how much you use them:

-
Status Chart: visual representation of drivers in your fleet, and divided into active, inactive, and unavailable drivers for the current date.
-
Active (Blue): number of active drivers that are currently completing tasks and driving on their routes for the current date. Displayed in blue on the status chart.
-
Inactive (Yellow): number of inactive drivers that don’t have tasks or routes assigned to them for the current date. Displayed in yellow on the status chart.
-
Unavailable (Red): number of drivers that are unavailable for task and route assignments for the current date. Displayed in red on the status chart.
-
Overtime (Total): total hours of overtime work by active drivers completing tasks and routes for the current date.
-
Overtime (Median): median hours of overtime work by active drivers completing tasks and routes for the current date.
-
Overtime (Average): average hours of overtime work by active drivers completing tasks and routes for the current date.
-
Vehicle Type: number of available vehicles in your fleet that drivers can use to complete tasks. Displayed as name of vehicle type and number of those vehicles.
Accuracy Metrics
Accuracy metrics show the performance of your operations. This includes data related to lateness when completing tasks and the time it takes to reach drop off destinations:

-
Lateness (%): all tasks that have been completed outside of the delivery window (late deliveries), displayed as a percentage of total tasks.
-
Lateness (#): number of tasks that have been completed outside of the delivery window (late deliveries).
-
Avg. Lateness: average latency for all late tasks (deliveries), displayed in minutes.
-
Max. Lateness: maximum latency for a late task (delivery), highest value in minutes.
-
Travel Time (Avg.): average driving time on a route, displayed in hours.
-
Travel Time (Max.): maximum driving time on a route, displayed in hours.

eLogii’s Historical Route Analytics
Our historical route analytics include nine seperate screens. Here you get an in-depth analysis of various route metrics over time that include:
Task Analytics
Task analytics shows all tasks based on their status:
Tasks are labeled as Completed, Failed, Canceled, and Pickup.
And eLogii can display them for the previous month, previous three months, previous six months, previous year, or a custom date range that you select.
Tasks can also be grouped by Date, Week, Month, or Driver.
Grouping them by a time range gives you insight into delivery performance of your team.
While grouping them by driver gives you insight into driver performance over time.
Failed Reasons Analytics
Failed reasons shows the reasons why tasks fail:

This is a custom feature which you can set up in the dashboard settings.
When a task fails, your driver can select the reason in the drop-down menu on the driver app. The data is stored and then displayed in this analytics tab.
Examples of failed delivery reasons can include:
- Nobody home
- Wrong address
- Late delivery
- Damaged package
- Wrong package
- And more
You can group and display the reasons by a specific date range, Driver, Team, or Customer.
Or you can select and deselect specific reasons for failed delivery to compare them.
Partially Completed Task Analytics
In this tab, you can view all partially completed tasks compared to all completed tasks for specific dates or date ranges:

The graph displays the number of partially completed tasks, as well as their percentage as part of all scheduled tasks for a specific date.
Here too, you can filter the tasks according to Date Range, Driver, or Customer.
On-Time vs. Late Task Analytics
In this analytics window, you can simply compare on-time delivery with late deliveries:

The graph displays the number of on-time and late deliveries, and their percentages as part of all scheduled deliveries for a specific date.
Lateness Analytics
The lateness analytics panel displays task lateness and how much time has passed after the delivery window was closed before a task was completed:

eLogii records the time at which a task was completed and uses that data to compare it to the time window set for that task during route planning.
In this tab, you can also exclude certain lateness data by defining the minimum and maximum lateness values that you wish to be displayed.
For example:
You can set the data to display a lateness between 10-30 minutes. Any value that is lower or higher than that will not be displayed in the graph.
Service Duration Analytics
The service duration analytics shows you how much time drivers spend at a location (dropping off packages and servicing your customers):

This tab can also show the exact time a driver reached the customer’s destination. And the exact time when he completed the task and moved on to the next stop.
And here too, you can define the minimum and maximum service duration values that you wish the analytics window to display. (Similar to the Lateness Analytics window.)
Route Duration Analytics
Route duration analytics displays how long it took drivers to complete their routes over time:

Just like before, it’s also possible to add minimum and maximum route durations that you want to observe and analyze.
Route Distance Analytics
Route distance analytics displays the total distance of all the routes on a given date or the total route distances traveled by a specific driver over period of time:

The distance can be displayed in kilometers or miles, depending on your configuration setup in the dashboard.
You can also set the minimum and maximum distance values to exclude unwanted data from the analytics panel.
Vehicle Utilization Analytics
Vehicle utilization shows you how much you have used your vehicles’ payload capacity during a route:

The value displayed is the percentage at the point of maximum usage of a vehicle on a route. And you can use it to display different vehicle dimensions (weight % or volume %).
If there are multiple dimensions of vehicle usage, the analytics will display the higher value.
For example, if you track vehicle utilization via both weight and volume, but weight usage is 70% and volume usage is 80%, the analytics panel will display volume (80%).
But you can filter these options and show vehicle utilization for all dimensions that you have added in the dashboard.
How Can eLogii Help You to Adopt Data-Driven Route Optimization?
Route optimization software, like eLogii, is meant to automate, simplify, and streamline how you plan and optimize delivery routes.
To determine the most efficient and cost-effective routes, it relies on a variety of information. This data can include everything from delivery locations, delivery time windows, order priority, driver availability, traffic, and multiple other constraints.
Here are the key data-driven features of eLogii that automate your delivery operations and make them more streamlined:
-
Constraints-based route optimization: eLogii enables you to add time and delivery constraints with our route optimization modes. You can enter delivery windows, order priority, balance vehicle loads, and determine how the software assigns tasks to drivers.
-
Live driver tracking: Driver tracking is one of eLogii’s main software features that lets you to keep track of driver locations in real time. It also gives you complete visibility over operations, and collects related to driver performance and any unexpected delays.
-
Data analytics and reporting: We’ve already mentioned in depth how and what kind of data and analytics eLogii can capture and display, both historically and in real-time. But you can also export this information as reports for customers and stakeholders.
-
Delivery status reports: eLogii allows you to set up notification links and automated text or email messages that you can share with customers. These reports give insight into the status of each delivery, with progress, status, and estimated time of arrival.
-
Proof of delivery: Drivers can collect proof of delivery using the driver app on their mobile devices. You can use this feature to collect customer information, which can help you to customize your service based on the individual needs of your customers.
-
Integration: eLogii’s powerful route optimization API allows you to connect with any other business software you use to manage your operations. This smooth cross-platform data sharing helps you to boost efficiency across other aspects of your business.
And there’s a lot more features and capabilities that you can still uncover.
So…

