How Food Delivery Route Optimization Lowers Costs & Raises Efficiency
In this blog, we’ll show you the must-haves of food delivery route optimization to save more time and money, and provide an unparalleled experience.
Home > Blog > 101 Delivery Statistics for 2020
3PLThis is a list of 101 delivery statistics relevant for 2020. The data will help you get a better feel for the current market and how to navigate it.
This is a list of 101 delivery statistics relevant for 2020.
The data here will help you get a better feel for the current market.
Not to mention, it will give you a better view of how to navigate it.
The list contains the most relevant statistics about:
Let’s dive right into it.
#1 24.8 billion deliveries are completed worldwide in 2020.
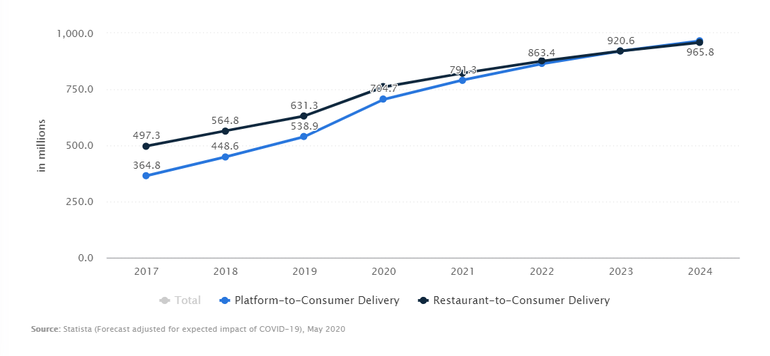
#2 704.7 million people will use platform-to-consumer delivery in 2020.
#3 The average cost of delivery is $6.4 per cubic meter.
#4 The average time per delivery is 12 minutes.
#5 Standard delivery takes approximately 3-5 business days to be completed.
#6 61% of customers prefer home-delivery to any other type of delivery service.
#7 70% of those customers are content with the cheapest form of home delivery option, while 23% of them would pay a premium price for same-day delivery.
#8 55% of shoppers in the US prefer same-day delivery to any other time of arrival.
#9 That’s because 58% of consumers don’t want to wait more than 40 minutes for their deliveries to arrive.

#10 It’s also why 30% of the total market share of priority same-day delivery belongs to the United States.
#11 But, in general, nearly half, or 44% of customers don’t mind waiting two days for their delivery to arrive.
#12 The reason is free shipping. 95% of consumers prefer free-one-day delivery as their ideal delivery method.
#13 And 48% of customers will add more items to their shopping cart if it means they qualify for free shipping.
#14 Companies that add a free shipping threshold can increase orders by 90%.
#15 This will see the last mile delivery market grow to $91.5 billion by 2030. A $79.5 billion rise compared to the value in 2019.
#16 And if forecasts for 2030 are right, there will also be a 78% increase in last-mile deliveries in urban areas across the world.
#17 eCommerce is driving delivery. That’s why 10% of all retail sales were completed online in 2019.
#18 At least 82% of all global consumers have shopped online in the previous three months.
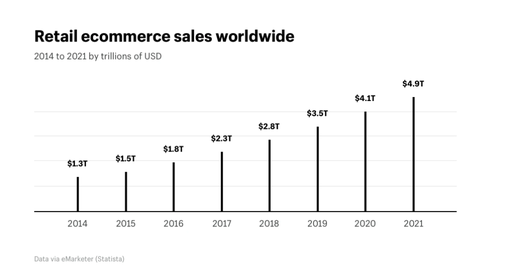
#19 Worldwide eCommerce retail sales will reach $4.9 trillion by 2021.
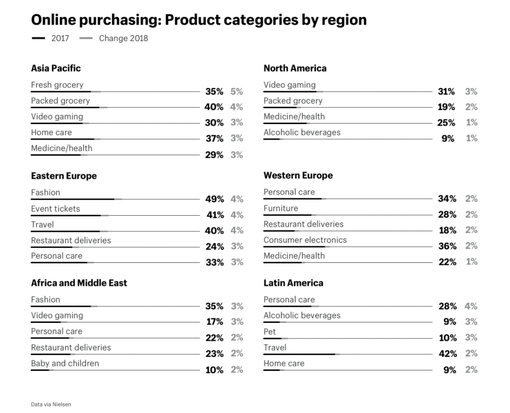
#20 When it comes to online shopping, a survey by Nielsen suggests these are the most common items you will find at checkout:
#21 But online shoppers in the US are willing to pay up to $5 for shipping.
#22 And this makes the last-mile worth approximately $115 billion out of the $270 total revenue pool from eCommerce.
#23 Amazon is a key player in eCommerce. That’s why 68% of all US consumers begin their search on Amazon.
#24 It’s one of the reasons Amazon.com has been able to generate $280.5 billion from eCommerce.
#25 However, Amazon shares fell from 42% before the COVID-19 outbreak to 34% in April 2020.
#26 But that’s not going to stop the company. Amazon has the largest delivery infrastructure in the world with 390 warehouses and over 20,000 delivery vehicles.
#27 It’s one of the reasons why it costs $16.2 billion to run Amazon’s reverse logistics operations.
#28 Still, 72% of Amazon deliveries are fulfilled within 24 hours for all of their customers.
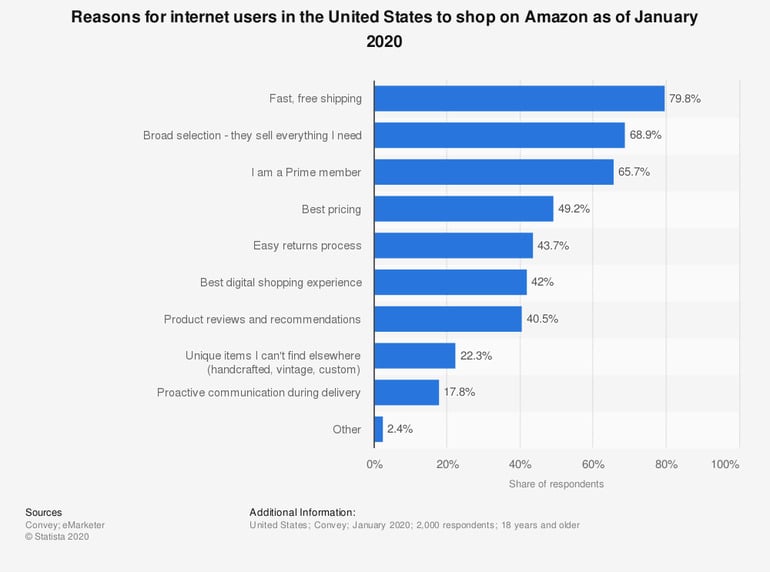
#29 That, and the ability to offer free shipping is why 79.8% of shoppers in the US choose Amazon. Other key factors include a broad selection of offers (68.9%), Prime membership (65.7%), and best pricing (49.2%).
#30 Key delivery statistics appear in every industry, including yours. For example, 32% of the furniture in the US will be sold online and delivered to the customers’ homes by 2023.
#31 When it comes to food delivery, the sale of grocery delivery and pickup in the United States has grown by $6 billion from August 2019 to June 2020.
#32 The number of orders has also increased from August 2019 to June 2020 by 68.9 million orders thanks to COVID-19.
#33 By contrast, only 1% of total alcohol sales in the US are completed online.
#34 And 41.7% of US consumers likely to purchase food online due to the Coronavirus
#35 However, 61% of consumers don’t expect to spend more on grocery delivery due to the outbreak of COVID-19. But, 17% say they will buy more groceries online.
#36 Nonetheless, there are 1,231.9 million food delivery users in the world in 2020.
#37 And in 2024, the number of platform-to-consumer delivery and restaurant-to-consumer delivery will be 965.8 million each.
 #38 And with a 25% year-over-year growth, the food delivery industry will rise to $182 billion by 2024.
#39 But it isn’t without its problems. In fact, 70% of all customer complaints with food delivery have to do with mismanaging the quality of service. That’s 6 out of 7 people. The most common complaints are the food isn’t warm or fresh enough (17%), the delivery is late (16%), incorrect order (12%), and that customer service ignores notes or instructions (12%).

#40 On the other hand, 52% of delivery personnel cite food orders not being ready for pick-up as their biggest complaint.
#41 This doesn’t prevent 79% of consumers choosing delivery over takeout if the restaurant is more than 3km away.
#42 And even 34% of consumers usually pay up to $50 per delivery when ordering food online.
#43 That’s why 31% of people in the US use third-party delivery services at least twice per week.
#44 59% of third-party logistics companies in the US believe that last-mile delivery is the most inefficient process in their supply chain.
#45 When it comes to healthcare and pharmacy delivery, only 1% of the total $275 billion in revenue came from online purchases.
#46 But by 2026, the global ePharmacy market will grow to over $177 billion (17.2% CAGR). A rise of 643% than the current market value.
#47 44% of businesses plan to increase their spending on technology in 2020.
#48 51% of companies are willing to invest in automation due to the coronavirus, with eCommerce (66%), food and beverage (59%), and third-party logistics (55%) companies more likely to invest than others.
#49 41% of supply chain professionals say that data analysis is their top priority for tech innovation. Cloud technology and IoT follow with 39%.
#50 46.1% of professionals are taking the cloud-first approach to manage delivery logistics.
#51 37% of companies have already adopted some form of AI in their day-to-day operations.
#52 But only 12% of supply chain professionals are successfully implementing AI in their operations.
#53 43% of companies that adopt automation have seen significant or moderate help during the pandemic.
#54 81% of supply chain professionals also see automation as the driving force behind reusable transportation packaging.
#55 And another 16% of last-mile delivery retailers and logistics providers mentioned electric vehicles among the most important next steps in the evolution of deliveries.
#56 43% of shoppers in the UK are willing to look for an alternative if a company doesn’t offer sustainable delivery options.
#57 60% of millennials shop online because they believe it leaves a smaller environmental footprint.
#58 49% of companies have sustainable supply chain goals, but 35% of their competitors lack them completely, according to an MIT study.
#59 The number of delivery vehicles in the top 100 cities around the world will increase by 36% by 2030. As a result, emissions from delivery traffic will rise by 32% and from traffic congestion by 21%.
#60 Innovative solutions, such as data-based connectivity, dynamic scheduling, route optimization, and load-pooling, could reduce CO2 emissions by 30%, congestion by 30%, and delivery cost by 25%.
#61 90% of people in the US cite customer service as a major driving force when making a decision.
#62 59% of consumers will never do business with a company after two or three negative experiences.
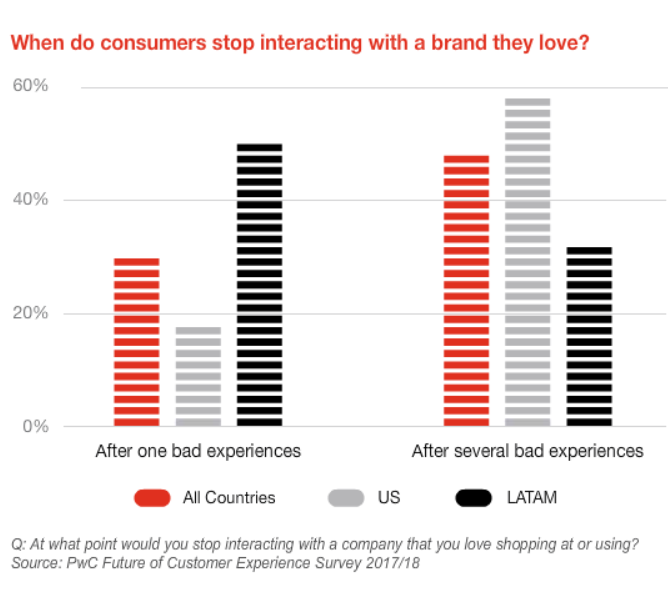
#63 96% of all customers say customer experience is an important part of their loyalty to a brand.
#64 13% of shoppers never return for another purchase if the delivery doesn’t arrive on time.
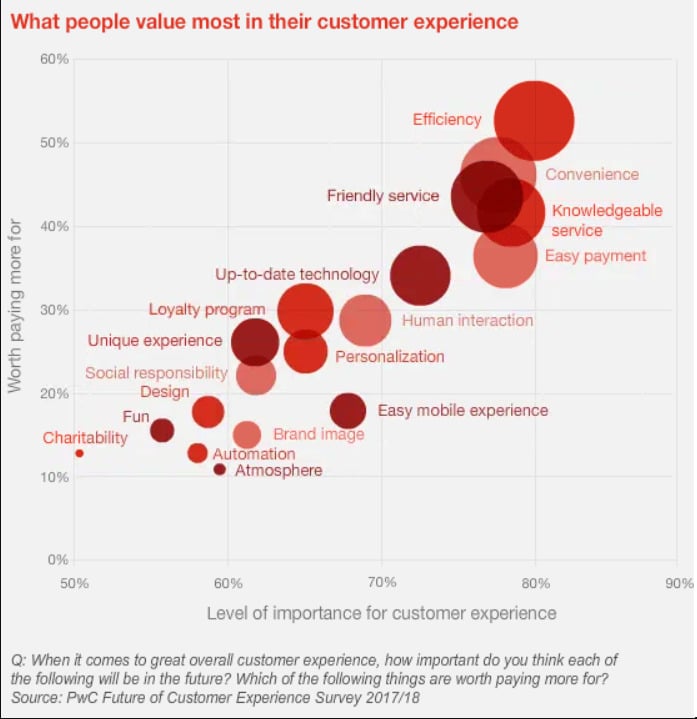
#65 80% of customers cite convenience, speed, knowledgeable help, and friendly service as the most important elements of good customer experience.
#66 86% of customers believe retailers should offer them the ability to choose the most convenient delivery option when ordering their goods.
#67 47% of customers say the delivery option they want is sometimes, rarely, or never available to them.
#68 61% of customers report that online retail companies have the delivery options that they want.
#69 Only 46% of direct-to-consumer brands offer delivery options that customers want.
#70 34% of consumers say long delivery time is the key reason to shop in physical stores instead of online.
#71 46% of consumers abandon online shopping carts if the shipping time was too long or wasn’t provided.
#72 86% of customers are willing to pay more for products and services, and buy more from companies that offer a great customer experience.
#73 88% of consumers don’t mind paying for faster delivery.
#74 81% of professionals say that their companies will mostly or completely compete in the future with others based on their customer experience.
#75 Last-mile delivery makes up 53% of all delivery operational costs.
#76 Organizations with optimized supply chains have 15% lower costs than companies that don’t focus on optimization.
#77 Only 4% of companies have an agile organization. 37% of companies have started the process of building an agile delivery.
#78 Key initiatives in operational optimization like delivery management platforms can reduce costs up to 20%.
#79 The most important last-mile delivery initiative is reducing cost.
#80 51% of supply chains see the lack of clarity on customer demand as the biggest issue stemming from COVID-19.
#81 The most common KPI for delivery logistics monitoring is daily performance (40%), closely followed by cost reduction (35%), as well as production service rate (29%) and inventory turn (28%).
#82 At 21.1%, visibility is the biggest challenge faced by delivery and supply chain professionals.
#83 It is closely followed by factoring consumer demand (19.7%).
#84 48.4% of brick and mortar stores serve as distribution centres or depot locations within their supply chain.
#85 53% of the total transportation cost comes from last-mile delivery.
#86 In-store delivery pick-up had a 554% YOY increase in May 2020.
#87 30% of all online deliveries are returned by customers.
#88 By contrast, only 8.89% of purchases made in brick-and-mortar stores.
#89 That’s 92% of customers say they will continue to do business with a company if the return process is easy.
#90 On the other hand, 57% of consumers say returning an item is a complete hassle or the process could be easier.
#91 That’s why 62% of customers are willing to shop at your online store if they can return an item at your physical store.
#92 67% of shoppers also check the return policy page before checking out their item and making a purchase.
#93 And 58% of shoppers want a no-questions-asked return policy, while 47% expect to see a return label on their purchase.
#94 The biggest reason customers cite for returning an item is receiving the wrong item (23%).
#95 This is followed by receiving an item that is different from their order (22%) and receiving a damaged item (20%).
#96 79% of customers want free shipping with their return delivery, but only 49% of retail companies offer free return shipping.
#97 If you offer them a free return with their purchase, 27% of customers are willing to spend over $1,000.
#98 That is why 60% of retail companies consider reverse logistics an important asset of their organization.
#99 But only 32% have an effective solution for managing reverse logistics.
#100 40% of US companies report their organizations to produce less waste as a direct result of their reverse logistics operations.
#101 72% of companies admit that they don’t have a suitable platform that can support reverse logistics operations.
That’s it.
But we can help you beyond statistics.
We have everything you need to start improving your delivery.
In this blog, we’ll show you the must-haves of food delivery route optimization to save more time and money, and provide an unparalleled experience.
We take a look at reverse logistics. What is it? How does it help you handle returns? And how to use reverse logistics to turn failure into...
Today, we’ll be discussing delivery logistics. Specifically, how vehicle routing and scheduling work as part of supply and delivery chain logistics.
Be the first to know when new articles are released. eLogii has a market-leading blog and resources centre designed specifically to help business across countless distribution and field-services sub sectors worldwide to succeed with actionable content and tips.
