Oftentimes, it is difficult to determine the success of delivery logistics. It might seem as though everything is going according to plan, that you are fulfilling enough orders to make returns, but then it turns out you are actually losing money at the end of each month.
The only way to know the state of your delivery is to use key performance indicators (KPIs) to evaluate various areas of your service.
That’s because numbers rarely lie.
Last-mile delivery KPIs are windows into a business, its success, and efficiency, and can tell you the truth about your delivery operations.
You can measure the achievements of your delivery service using a powerful digital logistics solution to monitor a handful of key metrics. From how accurately or timely drivers pick up or drop off deliveries, to how efficiently operations managers spend and distribute resources.
Not only does using KPIs in logistics let you take quantifiable steps to gauge the performance of your service, but it also allows you to find the strengths and weaknesses in your delivery logistics. And once you know that, you can take action to increase the effectiveness of the whole network and its output efficiency.
So, start measuring performance to get a better understanding of your delivery operations. Here are seven key logistics metrics that can help you:
7 Key Metrics In Delivery Logistics
- Number of Deliveries
- On-Time Delivery
- Order Accuracy
- Transit Time to Distance
- Vehicle Capacity vs. Available Capacity
- Average Time Per Delivery
- Average Cost of Delivery
1. Number of Deliveries
The number of completed deliveries of your products or services. Typically it is the sum of all deliveries within a month, quarter, or year.
Even though it is an obvious metric to follow, it’s also the one by which all others will measure. It’s also the number that determines the effectiveness of the entire delivery operation.
Analysts also use it to calculate the average number of deliveries, which is useful to identify the potential for growth, especially when deliveries exceed or lag behind operational capacities.
2. On-Time Delivery
The number (or percentage) of deliveries carried out on time specified by the customer’s order, while the remaining figure points out late deliveries.
On-time delivery metrics provide a quick yes-or-no poll of the quality of the delivery service.
Finding out which orders were delivered late helps operations managers work out the source of the problem, and address it. So, it’s worth taking a better look at when your agents and drivers complete their deliveries, and the best way is via the on-time delivery KPI.

3. Order Accuracy
The percentage of orders executed free of errors when compared against the total number of orders delivered. Also called the perfect order measurement, it lets you identify inaccuracies during the delivery process, either as failed deliveries, mistaken orders, returned, or damaged goods.
The order accuracy rate is calculated using this simple perfect order fulfilment formula:

An error order can occur at any point during fulfillment. That’s why it is frequently measured for the entire service as well as at each stage of the delivery process:
- Inventory forecasting;
- Procurement of products and services;
- Invoicing of delivery orders;
- Depot planning and pick-up;
- Transportation and drop-off.
Because inaccuracies can happen throughout the delivery lifecycle, it is difficult to track the accuracy rate as it relies on drivers, operations managers, or customers to report errors.
One way to work around this problem is to make it easier to submit reports. For example, implementing advanced logistics software helps operations managers detect errors in delivery because it gives customers the ability to rate and submit feedback about their experience.
4. Transit Time to Distance
The time drivers and couriers spend during transport from the pick-up site to the drop-off location.
Measuring the metric provides an overview of the speed of the agents in the field and the efficiency of their delivery routes.
But as drivers affect their routes, and routes affect the drivers on them, tracking this KPI is an unbiased way of maintaining the effectiveness of both.
5. Vehicle Capacity vs. Available Capacity
The capacity of a vehicle that delivers products or services relative to its total capacity. It shows the amount of idle space not used for order fulfillment, and to calculate it, all you have to do is divide the available capacity with the total capacity of a vehicle or fleet.
Monitoring these last-mile delivery metrics is useful for vehicle management, as you can apply it across the fleet and use it to determine the profitability of your operations.
When there is a high availability rate, this indicates inefficiencies in the loading procedure or the need to merge delivery routes. On the other hand, if the rate is low or negative, the capacity of the current delivery fleet is insufficient and demands expansion.
6. Average Time Per Delivery
The average time it takes to complete a delivery over a specific period. It offers insight into the effectiveness of the supply chain network, as well as the efficiency of the planned delivery routes.
Also called the average service time metric, you calculate it by dividing the total delivery time with the number across a predetermined interval (day/week/month/quarter/year).
It’s important to keep the number consistent. Too much ebb and flow can indicate issues that affect the delivery schedule.
Comparing different averages over equal periods helps managers root out problems by knowing which drivers they need to talk with or what routes to optimize.
7. Average Cost of Delivery
The average cost of delivering products or services based on specific key parameters. It is usually calculated based on distance (mile/kilometer), type of delivery (item), or type of vehicle.
In each case, the parameter determines how the cost will be measured. When it comes to distance the formula is:

For vehicle and delivery type the formula is somewhat different, as it needs to take into account the specific item or vehicle in question:
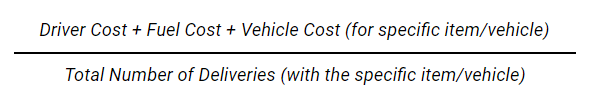
Companies can then use these averages to implement changes to the service, which might reduce its cost without affecting performance output, like using better vehicles or implementing route optimization software.
We have everything you need to start improving your delivery.

