Technician productivity determines whether a field service operation makes money or burns it. And for years, the default response to declining productivity has been the same:
Hire more planners.
The logic feels sound.
More planning capacity should mean better schedules, fewer conflicts, and technicians spending more time on productive work. Most operations leaders we've spoken with have made this exact call at least once. Some have made it 5-6 times.
This article examines why that instinct, while rational at small scale, produces the opposite of its intended effect as operations grow.
We'll walk through:
- The structural relationship between planner headcount and field service technician productivity
- The math behind coordination cost
- The point at which adding planners begins to drag on the metric they were hired to protect
- And more
By the end, you'll have a clear framework for understanding where your operation sits on the coordination cost curve and what changes the trajectory.
Here's a quick overview of what's in this article:
Key Takeaways
- Planner headcount usually rises after productivity starts falling. It's a response to the problem, not a prevention of it.
- Coordination cost between planners scales exponentially. The number of coordination paths between n planners grows by n(n-1)/2, not linearly.
- Technician productivity is an execution outcome. A technician can work hard all day and still score low if the coordination layer around them generates wait, rework, or schedule conflict.
- SLA pressure accelerates the decline. Each SLA escalation creates 4-6 additional coordination interactions, compounding the overhead planners already carry.
- Productivity improves when systems absorb coordination cost. The operations that hold strong technician performance at scale have moved routine execution decisions from people to systems.
We Hired Field Service Planners to Protect Technician Productivity... So Why Isn't It Working?
Every field service leader has been in this meeting:
- Utilization is slipping.
- SLA breaches are ticking up.
- Technicians report waiting on instructions
- Technicians receive conflicting schedules
The solution everyone agrees on:
Bring in another planner.
And it works. For a while.
The new planner picks up overflow, response times improve, and the team feels less stretched. The evidence appears to confirm the assumption that more coordination capacity equals better technician performance.
But zoom out and a different pattern emerges.
Planner headcount in most enterprise field operations grows reactively.
The third planner gets hired because the first two are overloaded. The fifth gets hired because the fourth can't cover a new region. Each hire is a rational decision. The aggregate effect is harder to see.
This article isn't a critique of planners. Planners are the essential connective tissue between job demand and field execution. The question is structural:
What happens to technician efficiency and productivity when the coordination layer itself becomes complex enough to generate the friction it was meant to eliminate?
More planners is a rational decision at small scale. Past a point, it becomes a mathematical drag on the productivity it was hired to protect.
Defining the Two Variables: Planner Headcount and Technician Productivity
Before we can examine the relationship, both variables need clear definitions.
What do field service planners do?
A field service planner translates job demand into executable technician schedules. They resolve conflicts between planned maintenance and reactive callouts, manage communication between the field and operations, and act as the primary buffer when plans break down.
In multi-region operations, planners also coordinate across teams, balance workloads between territories, and handle SLA-driven reprioritization throughout the day.
What technician productivity measures?
Technician productivity is the percentage of total available working hours a technician spends on billable or completed service activity. The technician productivity formula is straightforward:
Technician Productivity Formula
Technician Productivity (%) = (Productive Service Hours / Total Available Hours) x 100
Industry benchmarks for strong utilization sit around 70-80%. Operations consistently above 75% are typically well-coordinated. Operations below 60% are losing significant capacity to travel, wait time, rework, or schedule gaps.
Why is technician productivity commonly misunderstood?
Many organizations track jobs completed or response times without isolating what causes technicians to be idle, traveling unnecessarily, or waiting on updated instructions.
A technician can be highly productive and focused on their work, delivering prompt fix times and quality work. But if they're fighting poor scheduling, traffic, or inventory management issues, their utilization rates can still remain low. (Despite their high productivity when actually working on jobs.)
The root of those losses is often coordination delay, not technician behavior.
Productivity is an execution outcome, not an effort metric.
A technician can be fully engaged all day and still post a low productivity score if the coordination layer surrounding them generates wait, rework, or schedule conflict. That distinction anchors everything that follows.
Common Assumption: More Planners = Better Coordination
With 10 to 20 technicians and low job variance, one or two planners can hold the entire picture in their heads:
→ They know each technician's location, skills, and current status.
→ They resolve conflicts quickly and execute adjustments in real time.
→ Response speed improves.
→ Technician idle time falls.
→ SLA compliance rises.
The evidence confirms the assumption. And at that scale, the assumption is correct.
Why Complexity Compounds at Scale
As technician count grows beyond 50, as regions multiply, and as the job mix shifts to include both planned maintenance and reactive callouts, the complexity of coordination doesn't grow linearly. It compounds.
Each additional technician, region, and job type multiplies the number of decisions a planner must make.
A planner managing 12 technicians across one region with a predictable maintenance schedule makes a fundamentally different number of decisions per hour than a planner managing 12 technicians across three regions with a 40% reactive job mix.
The combinatorial pressure extends to the planning team itself. The number of potential coordination interactions between n planners scales roughly with n(n-1)/2.
A team of two planners has one coordination path. A team of five has 10. A team of 10 has 45. This is why the planning team itself becomes a source of execution friction once it passes a threshold.
Coordination overhead doesn't only run between planners and technicians. It runs between planners and planners.
The relationship between planners and productivity is not linear. It is a curve with a peak, and most enterprise operations are already past it.
Where the Math Starts to Break Down
Coordination overhead, defined precisely:
Every interaction between a planner and a technician, between two planners resolving a conflict, or between a planner and a manager escalating an SLA issue consumes time that is not directly productive. It displaces execution capacity.
Four mechanisms compound as planner headcount grows:
- Handoffs and rework. When multiple planners touch the same job queue or region, decisions made by one get revisited or overridden by another. Technicians receive conflicting instructions, the schedule shifts mid-day, and completed preparation work is wasted.
- Decision latency. As the planner count rises, so does the time required to reach a consistent decision on a non-standard job. The technician waits in the field while the coordination layer resolves the ambiguity.
- Conflicting priorities. In organizations with both planned and reactive work, different planners often hold different views of priority. One protects the planned maintenance schedule. Another responds to an urgent callout. The negotiation overhead slows dispatch for both.
- Load distribution imbalance. Workload rarely distributes evenly across planners. Some carry high decision volume while others manage quieter queues, creating bottlenecks that increase average decision time without proportional productivity gains.
Every planner added increases coordination cost faster than it increases control. Past a threshold, the net effect on technician productivity is negative.
Consider the pattern at different ratios:
| Ratio |
Coordination Pattern |
Planner Time Spent on Exceptions (%) |
Impact on Technician Productivity |
| 1:20+ |
Planner overloaded; reactive only |
70-80% |
Negative: too few planners to plan proactively |
| 1:10-15 |
Balanced; planner manages field directly |
30-40% |
Positive: coordination overhead is manageable |
| 1:5-8 |
Planners coordinating with each other as much as the field |
50-60% |
Flat to declining: overhead absorbs gains |
| 1: below 5 |
Planning layer is its own bottleneck |
60-75% |
Negative: coordination cost exceeds contribution |
The sweet spot sits in a narrow band. Moving in either direction - too few or too many planners - reduces service technician productivity.
The Coordination Cost Curve
The shape of the relationship between planner headcount and technician productivity follows a recognizable pattern:
Productivity rises as planners are added up to a point, because more coordination capacity genuinely reduces technician idle time and improves schedule density.
Then it peaks.
Once planners spend the majority of their time managing each other's decisions rather than directing field execution, the coordination cost of the planning layer exceeds its contribution to output.
Productivity falls, not because technicians are less capable, but because the instruction layer has become the bottleneck.
Organizations cross this line without noticing it, and decision to add each new planner appears rational in isolation:
The existing team is visibly overloaded.
But the aggregate effect only shows up in productivity metrics over time, not in any single hire decision.
This pattern applies broadly across complex operations:
Adding coordination capacity to a tightly coupled execution system does not decompress the system. It adds more coupling.
Each new planner creates new coordination paths, new handoffs, and new opportunities for conflicting decisions that reach the technician as delay.
Why SLA Pressure Accelerates the Decline
SLAs introduce hard deadlines that override the existing schedule. When a breach is imminent, planners drop current coordination tasks and redirect technicians mid-route.
The escalation loop works like this:
An SLA breach triggers a management intervention, which generates an override instruction to a planner, who must re-sequence a region's schedule, contact affected technicians, and log the change.
Each escalation event produces four to six additional coordination interactions that wouldn't otherwise exist.
Organizations with high reactive-to-planned work ratios experience this loop dozens of times per day.
Each loop adds coordination overhead that prevents planners from improving the baseline schedule. The more time planners spend fighting fires, the worse the baseline gets, which generates more fires.
The paradox is hard to miss:
Operations under the heaviest SLA pressure are often the ones with the highest planner headcount.
Each SLA escalation prompts the same instinctive response: to add coordination capacity. But SLA pressure isn't a headcount problem. It is a speed-of-decision problem.
SLAs amplify coordination cost faster than headcount can absorb it.
Why FSM and Scheduling Tools Don't Change the Math
FSM and CAFM platforms are legitimate, valuable systems of record. They manage:
- Work orders
- Asset histories
- Compliance data
- Service contracts
- Technician skill profiles
This infrastructure is essential. But their limit shows up at the execution layer:
FSM platforms organize what work exists and when it is due. They don't autonomously resolve execution conflicts as conditions change during the day.
When reactive demand interrupts planned schedules, field service planners still make real-time trade-off decisions.
A calendar or schedule board gives planners better information, but it doesn't eliminate the cognitive and communication overhead of executing that information across 50 to 200 technicians in live conditions.
Back-and-forth communication with the office team can quickly eat into a technician's productivity. And technicians can't call or text the office with every update.
Tools that rely on humans for execution decisions inherit human scaling limits.
Adding more visibility to a coordination-heavy process does not reduce coordination. It makes the coordination better informed, which helps. But doesn't change the structural bottleneck.
FSM and CAFM platforms are systems of record, not execution engines. The distinction matters because it clarifies what kind of solution the coordination cost problem actually requires.
What Actually Improves Productivity at Scale
The cause of productivity decline isn't a lack of information, planner effort, or tools. It's that coordination cost is being carried by people. And humans don't scale linearly with complexity.
Four capabilities change the curve:
- Continuous re-optimization: Schedules aren't built once and then managed through exceptions. It recalculates continuously against live conditions, rebalancing workloads as technicians finish early, fall behind, or encounter on-site delays.
- Rules-based trade-off resolution: SLA priority, skill matching, geographic sequencing, and job type constraints are codified as system rules. The system resolves routine conflicts without requiring a planner's involvement in each decision.
- Automated execution decisions: Job assignments, route sequences, and schedule adjustments flow to technicians directly from the system, reducing the volume of planner-to-technician communications required per day.
- Exception-focused planner roles: Planners shift from managing every job to supervising the cases the system cannot resolve: unusual access requirements, customer escalations, safety issues. This is where human judgment genuinely adds value.
Productivity improves when systems absorb coordination cost. The planning layer becomes smaller in scope, but not in importance.
| |
Human-Led (Planner-Heavy) |
System-Led (Automated Execution) |
| Schedule updates |
Manual, batched, reactive |
Continuous, condition-responsive |
| SLA conflict resolution |
Planner negotiation, escalation loops |
Rules-based, automatic reprioritization |
| Reactive job insertion |
Planner phone calls, schedule rebuild |
System absorbs and re-optimizes live |
| Technician idle time management |
Planner identifies gap, manually reassigns |
System detects gap, auto-assigns next job |
| Planner role |
Manage every job and conflict |
Supervise exceptions and edge cases |
| Scalability |
Linear with headcount |
Scales with compute, not people |
eLogii Helps You to Improve Technician Efficiency and Performance at Scale
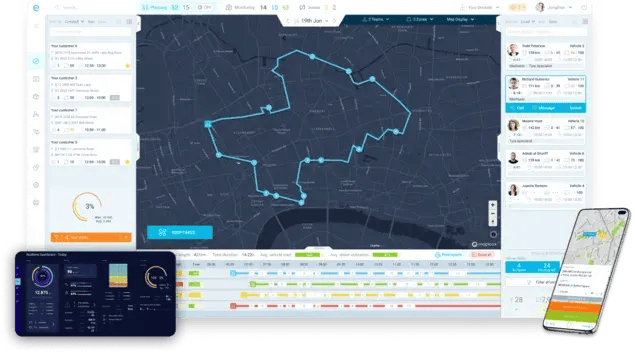
eLogii is the execution layer for field operations. It's the infrastructure that sits between the system of record (FSM or CAFM) and field service technicians, absorbing coordination cost at the point where it accumulates most.
In operational terms:
eLogii continuously re-optimizes technician schedules against live conditions, applies rules-based logic to resolve SLA conflicts and reactive insertions without planner intervention, and sends updated execution instructions directly to technicians via mobile.

The result is a measurable reduction in the volume of coordination interactions the planning team must handle per day.
Key thing to note here:
eLogii doesn't replace FSM or CAFM tools. It extends them.

Work orders, asset data, and service contracts remain in your system of record. eLogii handles the dynamic execution layer that existing FSM platforms were not designed to perform at scale.
eLogii is used in facilities management, pest control, property maintenance, utilities, and multi-region field operations. These are the same environments where planner headcount tends to grow in response to execution complexity.
The operations that improve technician productivity without growing planner headcount are typically the ones that have moved coordination cost from people to systems.
Who This Analysis Applies To
This structural argument applies to field operations running 50 or more technicians across multiple regions, with dedicated planner or dispatcher teams, a mix of planned and reactive work, and SLA- or compliance-driven delivery requirements.
The characteristics that make the coordination cost curve most relevant:
- High day-to-day job variance
- Reactive demand that disrupts planned schedules
- Planner teams of three or more
- Technician utilization that has plateaued or declined
This analysis doesn't apply to static route operations with low day-to-day variance such as:
- Fixed delivery rounds
- Single-region teams below 25 technicians
- Operations where job type and technician assignment are fully standardized
In those environments, planner headcount and productivity have a simpler, more linear relationship.
| |
Applies |
Doesn't Apply |
| Technician count |
50+ across multiple teams |
Under 25, single team |
| Regional spread |
Multi-region, multi-territory |
Single depot or region |
| Job mix (planned + reactive) |
Mixed, with significant reactive volume |
Fixed, repeatable routes |
| SLA / compliance obligations |
Contractual SLAs, penalty exposure |
Informal or self-imposed targets |
| Planner team size |
3+ dedicated planners or dispatchers |
1 planner or owner-managed |
| Schedule variance |
High daily variance, frequent changes |
Predictable, low-change schedules |
Bottom Line: Hiring Planners Doesn't Improve Technician Productivity, Better Field Service Execution Management Does
Planner headcount growth is a predictable response to rising operational complexity. At small scale, it works. Past a point, the coordination cost generated by the planning layer itself becomes the primary drag on technician productivity.
This is a structural problem.
The same dynamics apply whether your planners are experienced professionals or new hires. And whether you're in facilities management, pest control, utilities, or municipal services.
What changes the curve is moving routine coordination decisions from humans to systems:
Continuous re-optimization, rules-based trade-offs, and automated execution instructions reduce the coordination overhead that planners currently absorb.
This is what frees field service planners to focus on the exceptions where human judgment matters.
If your operation has growing planner headcount and flat or declining technician productivity, the math in this article explains why.
The question isn't whether your planners are working hard enough.
It's whether the structure surrounding them allows productivity to improve.
And if you're looking to solve this problem for your field service operation, we've got you covered.
FAQ about Technician Productivity
What is the technician productivity formula and how is it calculated?
The technician productivity formula is: Productive Service Hours / Total Available Hours x 100, expressed as a percentage. Industry benchmarks recommend maintaining 70-80% utilization rates. Tracking utilization rather than raw job count matters because a technician can complete many jobs but still have low productivity if excessive travel, wait time, or rework consumes their available hours.
At what planner-to-technician ratio does coordination overhead start reducing productivity?
The tipping point varies by operation complexity, job mix, and region count. There's no universal ratio. The signal to watch is whether your planner teams spend more time coordinating with each other - resolving handoff conflicts, aligning on priorities, escalating decisions - than they spend directing field execution. When inter-planner coordination consumes more than half the planning team's time, you've likely passed the inflection point.
Why do SLAs make technician productivity harder to protect, not easier?
Each SLA escalation triggers a cascade: management override, planner re-sequencing, technician redirection, and schedule logging. That's four to six additional coordination interactions per event. In operations with high reactive-to-planned ratios, these loops repeat dozens of times daily, consuming the planner capacity that would otherwise go toward improving baseline scheduling and reducing technician idle time.
How is eLogii different from standard FSM or CAFM software for managing technician productivity?
FSM and CAFM platforms are systems of record. They manage work orders, assets, contracts, and compliance data. eLogii is the execution layer that absorbs dynamic coordination cost - continuously re-optimizing schedules, resolving SLA conflicts through rules-based logic, and delivering updated instructions to technicians in real time. The two are complementary, not competitive. eLogii extends your FSM, it doesn't replace it.
How do you know if your operation has crossed the coordination cost tipping point?
Three observable signals: first, technician utilization has plateaued or declined despite adding more planners. Second, technicians regularly wait on updated instructions or receive conflicting schedules from different planners. Third, reactive work routinely overrides planned schedules without any structural mechanism to re-optimize the day - just manual planner intervention each time. If all three are present, coordination cost is the likely root cause.